ggtree
 ggtree copied to clipboard
:christmas_tree:Visualization and annotation of phylogenetic trees
I installed ggtree and ggplot using: **devtools::install_github(c("hadley/ggplot2", "GuangchuangYu/ggtree"))** But I still have this error: **Error: 'reroot' is not an exported object from 'namespace:ggtree'** When I try to lunch th command:...
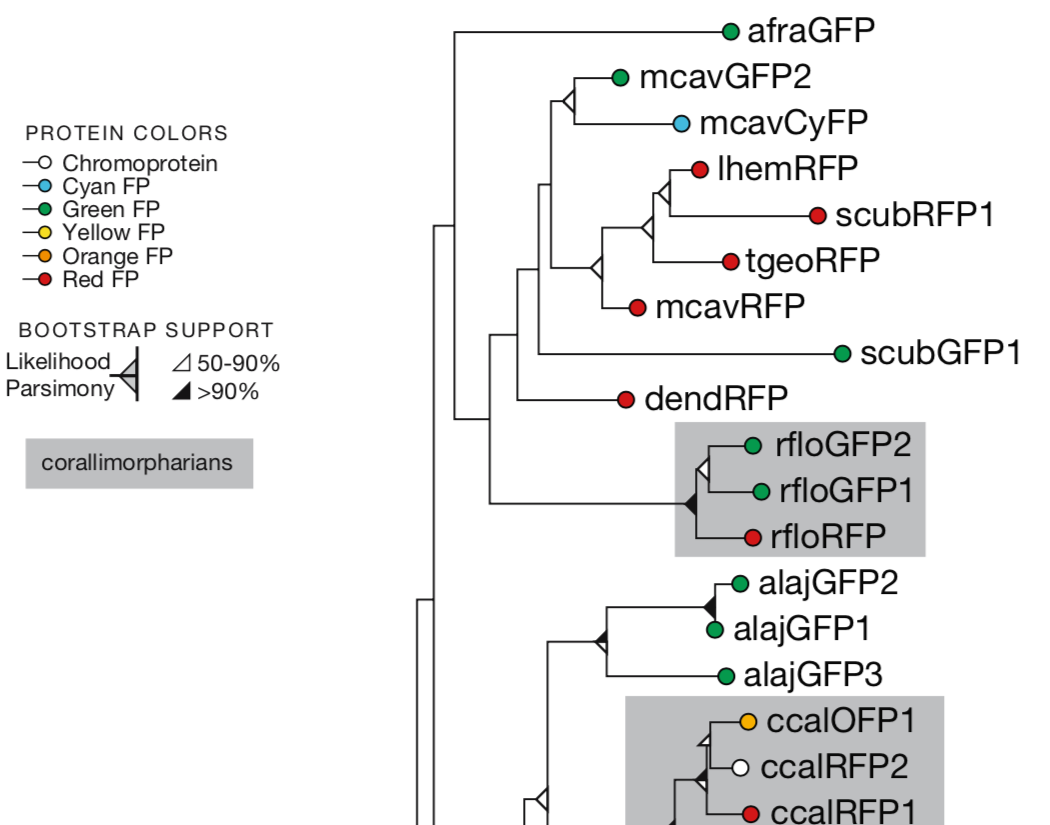
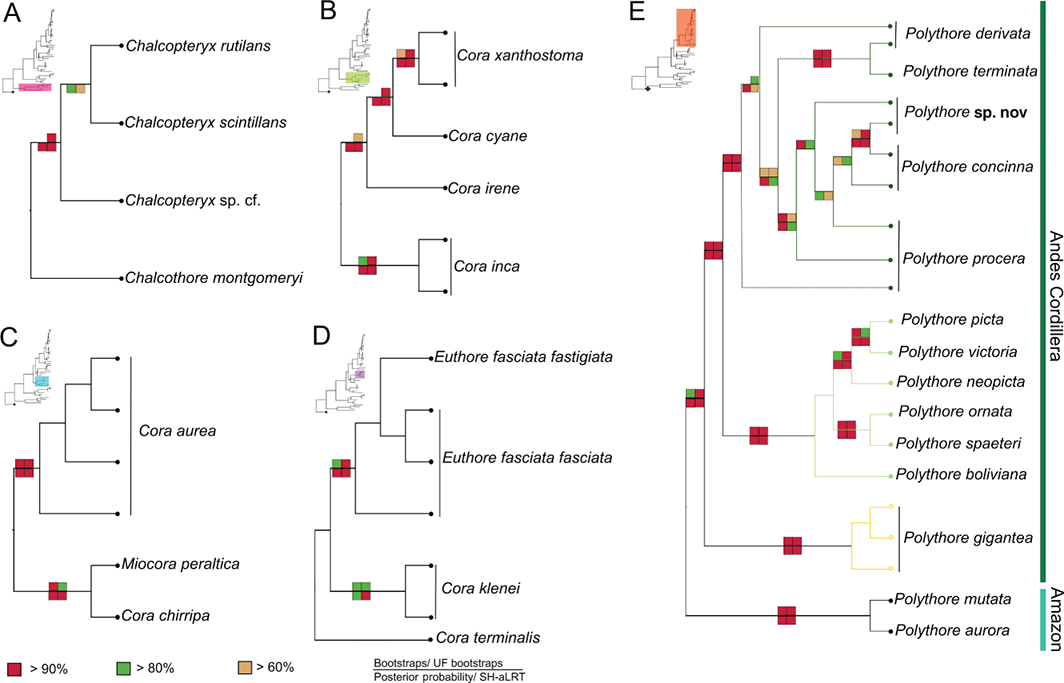
  There are different methods to calculate support values and we may want to display all these pieces of information simultaneously. @xiangpin I think your package can help in...
Hi, I am trying to use ggtree and gheatmap to visualize the marker genes from different single cells, and I got the left plot. Obviously, the marker pattern between different...
Hi there, I would find very useful if it would be possible to add values to gheatmap cells. The gheatmap function allows to easily display a matrix of cells colored...
[In the phytools package there is an option to plot clade names as an arc using the arc.cladelabels function](http://blog.phytools.org/2017/05/arccladelabels-using-names-of.html). ```{r} library(ape) library(phytools) library(ggplot2) library(ggtree) set.seed(200) tree
I would like to make a plot as hinted here: https://github.com/YuLab-SMU/ggtree/issues/87 e.g. a densitree with a timescale with 0 at the tips, and -crown_age at the root. However, the following...
### Prerequisites + [x] Have you read [Feedback](https://guangchuangyu.github.io/ggtree/#feedback) and follow the [guide](https://guangchuangyu.github.io/2016/07/how-to-bug-author/)? * [x] make sure your are using the latest release version * [x] read the [documents](https://yulab-smu.github.io/treedata-book/) * [x]...
Hello I have been creaating really cool plots with ggtree, thank you so much! The latest thing that I was asked to do is a SNP tree. I am wondering,...
Hi, I'm trying to draw a handful of phylogenies in ggtree, however, my R session aborts when calling the function, after encountering a fatal error. Unsure what is causing this....
`geom_tiplab` is causing conversion to `plotly` via the `ggplotly` function to fail, and produces a nonsense chart. Here is a minimal reproducible example [from the tree data book, section B.1](https://yulab-smu.top/treedata-book/related-tools.html):...
