enrichplot
 enrichplot copied to clipboard
Visualization of Functional Enrichment Result

Hi, I am trying to use the very basic function of "cnetplot" to show enriched pathways and the corresponding gene expression changes within the enriched pathway. I am doing this...
``` library(clusterProfiler) data(geneList, package="DOSE") gene 2] ego3
If nCluster is set to = 5 (as default), treeplot behaves as expected:  However, if nCluster is increased to 10 or higher, treeplot now misassigns both the cluster colour...
Hi, I am using the treeplot function to visualize the result of comparecluster, may I know how can I re-arrange the order of labels as highlighted in yellow (under the...
Hi, Awesome package. I was exploring some visualization with `gseaplot2` and noticed that there is no direct control over relative plot widths. ``` aplot::plot_list(gglist = plotlist, ncol = 1, heights...
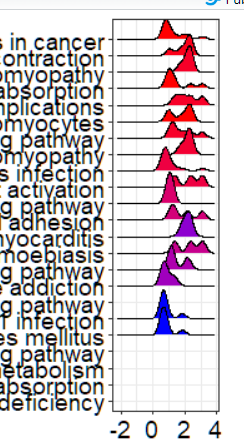 Dear Yu , When using ridgeplot to draw a picture, it seems that there are always several items that cannot be drawn for gseresult. This is very strange. After...
Thanks for your great project! The treeplot of compareClusters is great to summarize enrichment results. But if we use long labels for the cluster names, we cannot read labels because...
想基于gseaplot2()做出的图做一些个性化的添加,但是按照ggplot2的方法,一层一层的添加图层好像不可以 例如 `p= gseaplot2(gsea_NT5E, geneSetID = ID_NT5E, # pvalue_table = T, base_size =9, color = "#63be48", subplots = 1:2, title = ID_NT5E) + annotate("text", x = 4, y = 25,...
Hi, thank you for this amazing package! For `cnetplot`, user can supply their own list and visualize the network. I'm wondering if it is possible to introduce the same feature...
Hi, Thanks for the very nice package. I am trying to use `cnetplot` function with a list object. However, I get the following error. In the manual, it is written...