v-charts
 v-charts copied to clipboard
基于 Vue2.0 和 ECharts 封装的图表组件📈📊
### Summary 简述 名字在小圆圈节点上显示  ### Expect 期望结果 名字在小圆圈节点前面显示  ### Reproduce 重现示例
### Summary 简述 设置宽度150高度150canvas里面的图表无法自动适配到150*150 ### Expect 期望结果 ### Reproduce 重现示例 
折线图连接空数据

### Summary 简述 我有n组数据,是n个传感器在特定时间采集的值,但是每个传感器的采集时间都是不一致的。怎么使得传感器形成的折线图能够连接起来 ### Expect 期望结果 我设置 connectnulls=true 没有用 ### Reproduce 重现示例
### Summary 简述 无法实现step-line的效果 ### Expect 期望结果 https://www.echartsjs.com/examples/zh/editor.html?c=line-step ### Reproduce 重现示例
### Summary 简述 tree 使用自定义图标 首次加载 name 和 symbol 不显示 点击后才显示,收回后再展开 ,子节点 图标会消失 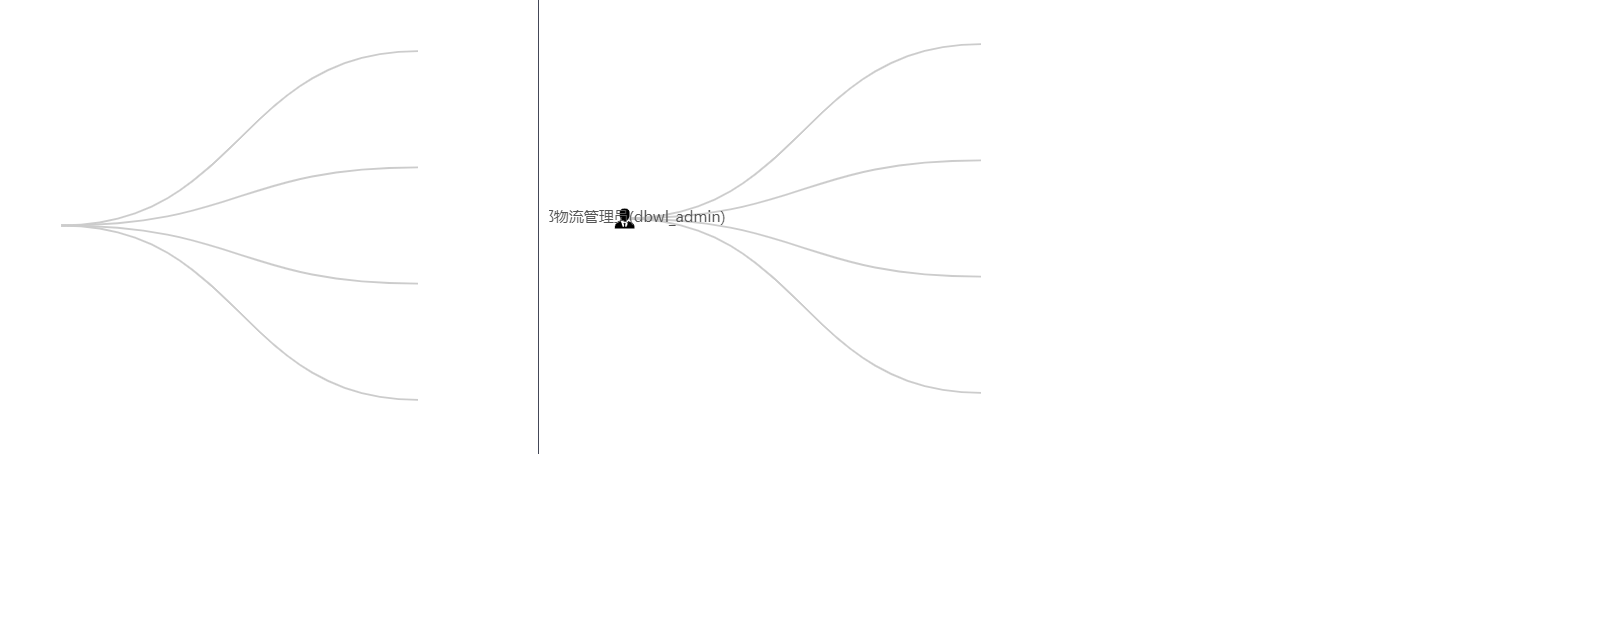 ` ` `const treeData = { name: '管理员(dbwl_admin)', symbol: 'image://http://192.168.0.111:8090/assets/images/manager/admin.png', 'symbolSize': [18, 18], 'children': [{ 'name':...

### Summary 简述 仪表盘自定义显示样式,无法实现 ### Expect 期望结果 https://codepen.io/pen?editors=0010 ### Reproduce 重现示例 ```js``` axisLabel: { textStyle: { // 属性lineStyle控制线条样式 fontWeight: "bolder", color: "#fff", shadowColor: "#fff", //默认透明 shadowBlur: 10 }, formatter: function(v)...
### Summary 简述 ### Expect 期望结果 ### Reproduce 重现示例
### Summary 简述 您好,就像题目里面说的一样,我现在的项目里面的图表是基于v-charts实现的,现在有一个地图的组件,也想这么做(用ve-map实现),但是因为对这个地图的精确度要求比较高,因此想请问ve-map是基于什么标准绘制的地图。 ### Expect 期望结果 希望了解ve-map绘制地图基于什么标准,谢谢。 ### Reproduce 重现示例