react-vis
 react-vis copied to clipboard
Data Visualization Components

The example page at [http://uber.github.io/react-vis/examples/showcases/plots](http://uber.github.io/react-vis/examples/showcases/plots) doesn't show a link to the implementation. Since this is the only chart with legends enabled, this is kinda bad. Solution: add a link to...
The documentation on ParallelCoordinates seems to be slightly vague, especially about configuring the axes (ex. increasing the number of ticks etc.) and brushing and highlighting on data points. I have...
Hello, I've plotted multiple Line series chart and enabled tooltip. When I do it, it's giving me the value of the last plot. How do I get the `Crosshair` values...
Hello, please help me to use the same color for the titles and for the strokes. I have a method where i generate colors. After that i want to use...
I'm trying to display a hint on a `LineSeries` object that has datapoints with `xType="time`" namely date objects. I can successfully pass the x, y co-ordinates using `onNearestXY` however when...
The sunburst chart shows the text perpendicular to the arc. Can this be rotated so that it goes along the arc and changes sizes to fit the size of the...
After highlighting a certain part of a chart, data points are shown outside of the axis. A sample of what this looks like is shown below: 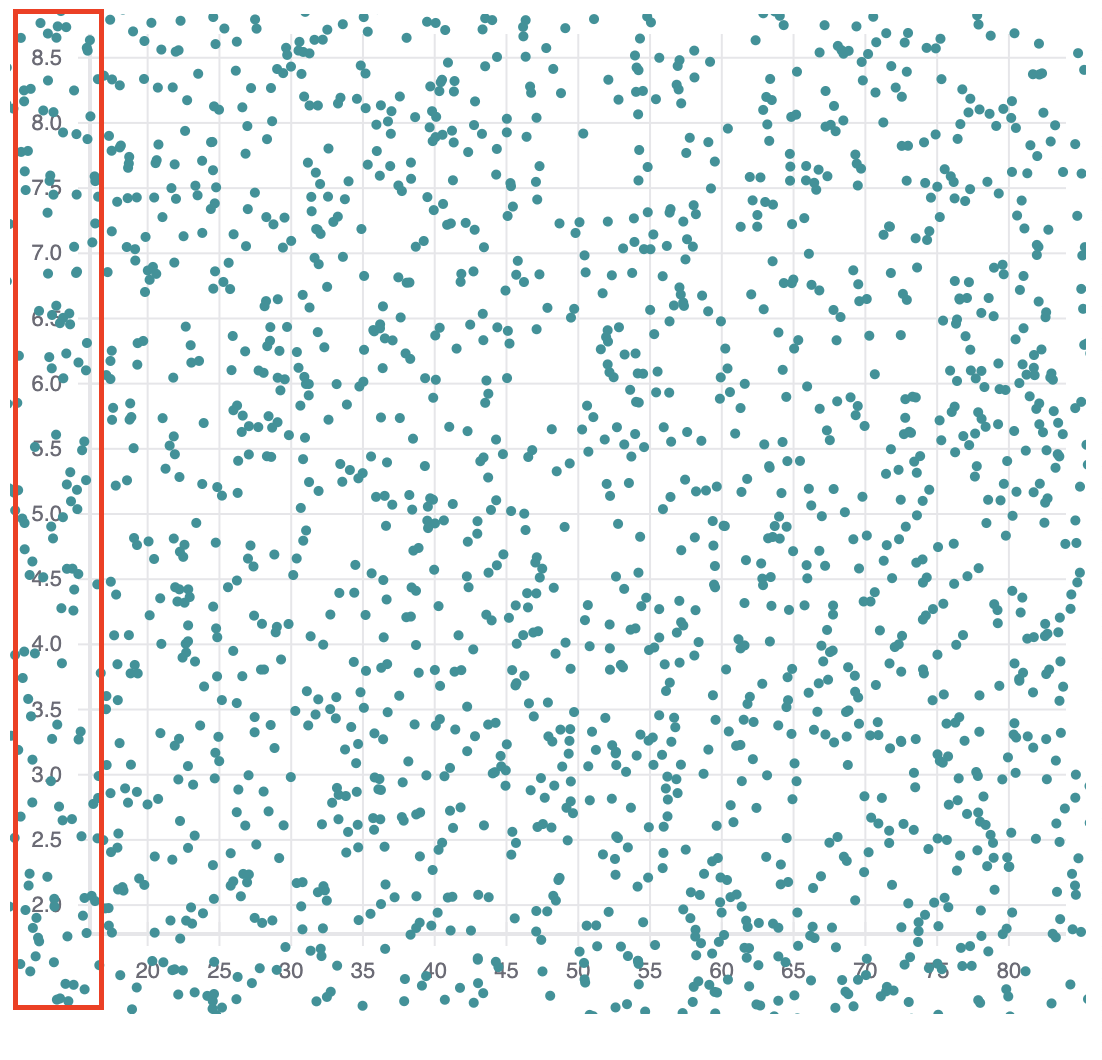 Is there any...
Hello, react-vis! I have a react-vis XYPlot with two LineSeries plots. On has data in the range like [-5,5] and another's data has the range [-1200,1200]. What is the best...
Hello everyone, I am trying to build a bar chart and I am facing the problem shown in the image below:  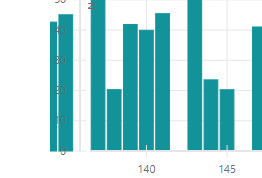 It seems like React is not obeying...
Hi @All Can anyone help about MarkSeries plot, I want to change the color or size of the point when I click that point thanks