react-vis

react-vis copied to clipboard
Axis Shifted/Showing more than my range in Vertical Bars Chart
Hello everyone,
I am trying to build a bar chart and I am facing the problem shown in the image below:

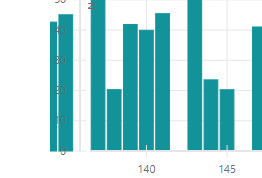
It seems like React is not obeying the range I set so the plot gets like that. So the values that are not within my range (but before that) are also being plotted
Here is my code
<div className="center">
            <FlexibleXYPlot height={250}
                  xDomain={[xRangeStart, xRangeEnd]}
                  yDomain={[yRangeStart, yRangeEnd]}>
                <VerticalGridLines />
                <HorizontalGridLines />
                <VerticalBarSeries data={plotDataArr} />
                <XAxis title="My X title"/>
                <YAxis title="My Y title" tickFormat={v => v/1000} left={-10}/>
            </FlexibleXYPlot>
</div>
Does anyone can help?