squidpy
 squidpy copied to clipboard
Spatial Single Cell Analysis in Python

## Description Follow-up feature to #481 - I think it could be nice for plotting to add a matplotlib ax keyword to all built-in plot functions which would allow passing...
Following the documentation and tutorials, code like ``` image = sq.im.ImageContainer(adata.uns["spatial"]["spaceranger100_count_30458_ST8059048_mm10-3_0_0_premrna"]["images"]["hires"], scale=adata.uns["spatial"]["spaceranger100_count_30458_ST8059048_mm10-3_0_0_premrna"]["scalefactors"]["tissue_hires_scalef"]) viewer = image.interactive(adata) ``` should work and has worked in the past. However, with Squidpy 1.2.0, it aborts...
## Description ... Thanks everyone for developing Squidpy. I just had a small request/question regarding plotting ligrec. After plotting ligrec dotplots, I usually want to see whether ligand or receptor...
Hi there, I am trying to get the result from each permutation in gr.ligrec, which is the mean expression of the ligand receptor pair in all interaction clusters. I thought...
Hello! I work with CODEX data across different conditions and I was wondering whether there is a way to visualise/summarise the differences in neighbourhood composition across the different conditions, after...
It would be great if this package could be distributed via condo-forge as well as pip. I'd like for `mamba install squidpy` to work so the package doesn't have to...
## Description (This is a suggestion/request; love the software) The dotplots output by `squidpy.pl.ligrec` are beautiful, but sometimes the number of ligand-receptor interactions can get unwieldy, and are not sorted...
- [ ] Additional function parameters / changed functionality / changed defaults? - [ ] New analysis tool: A simple analysis tool you have been using and are missing in...
## Imege rotation Hi, when plotting cell position on top of images (sc.pl.spatial) would it be possible to apply a predefined rotation to it? This could either be an argument...
Hi, May i know what the color represents in the segmentation image on the right ? 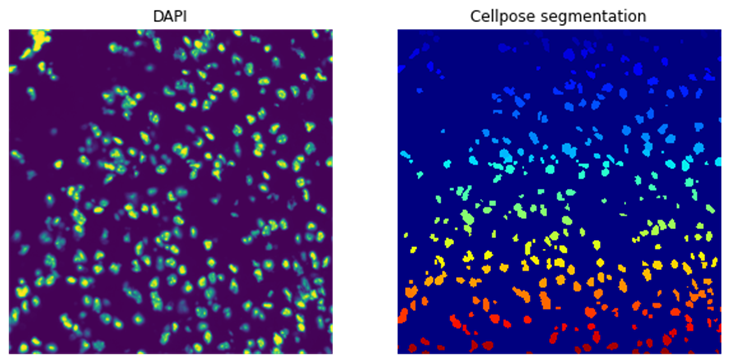 Thanks