Michael Krabbe Borregaard
Michael Krabbe Borregaard
Shouldn't be too hard to add - it's an extra empty subplot with a color bar. The gradient illustrates the degree of positive or negative correlation.
Possibly but is the bar width and the spacing not two slightly different things you'd like independent control of?
In R it's additive. So it shifts the position of the center of the bar on the x axis by bar-width + space for each new bar.
Yeah there are a lot of somewhat-independent-but-interconnected factors - space-within-group , space-among-groups, bar-width and distance-between-group-centers (the x ticks). Different plotting packages and languages have different implementations. Really not sure what...
That is not due to `@df` but to the groupedboxplot recipe. We don't normally expect you to be including StatsPlots in a module, but to use RecipesBase instead. However, I...
We already have ```julia @df school density(:MAch, group = (:Sx, :Sector), layout = (2,2), link = :all) ``` 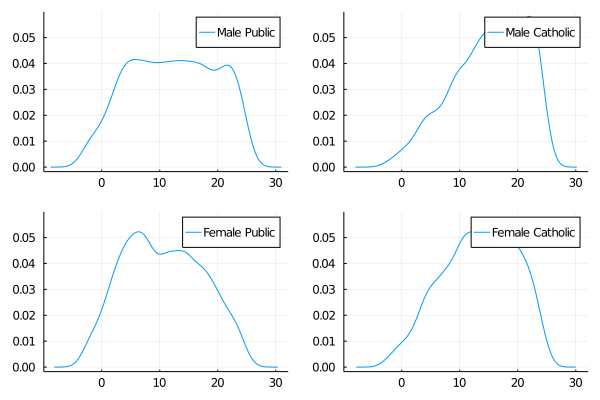 Can you see a good way of improving on this? A...
It strikes me that perhaps 2, 3 and 4 above are easily handled by recipes. Would you like me to try and implement recipes for these and open a PR...
Yes, this would fit great here
Thanks! So this plot is very simple (you could essentially get this with `smooth = true` in the plot command). But if we want general plotting of statistical objects: 1....