Feature request: facets
It would be really nice if StatsPlots could support faceting (i.e. making subplots by grouping by a variable in a table). I think it would make sense to use the seaborn syntax, e.g.
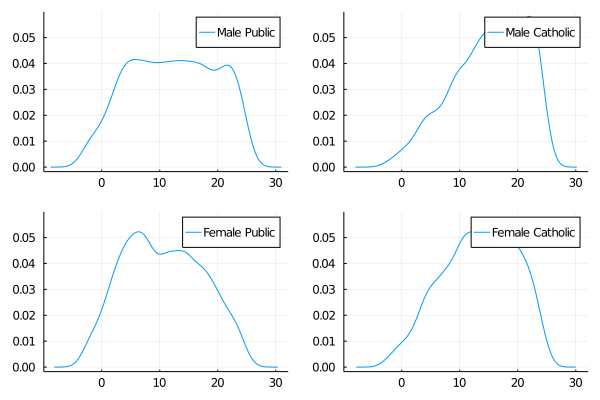
@df school density(:MAch, row = :Sx, col = :Sector)
to create four subplots laid out in a grid with subplot titles like "Sx = Girls, Sector = Catholic".
Easy construction of facets is in my opinion one of the two biggest things missing from the julia plotting ecosystem (as far as I know) when compared to Python (seaborn) and R (ggplot). (If you're curious, the other thing is a simple syntax for plotting summary statistics).
It seems to me that this would be a straightforward extension of the existing grouping machinery. But the fact that this hasn't been implemented already makes me think I must be missing some nuance that makes this tricky... I'd be happy to work on a pull request if this is something you'd be likely to accept.
We already have
@df school density(:MAch, group = (:Sx, :Sector), layout = (2,2), link = :all)
Can you see a good way of improving on this?
A little more powerful, and probably soon going to be plotting-package-independent, is here: http://juliaplots.org/AlgebraOfGraphics.jl/stable/generated/tutorial/#Layout
Ah excellent! This is already most of the way there. As the obi-wan meme that you edited out (but I was fortunate enough to see in the email notification) suggested, I think this might be an un(der)-documented feature.
Since you asked, I see two ways this could be improved:
- Make an option to label the groups with subplot titles rather than a legend—currently, the legend becomes difficult to read if you also have three groups (one being the color)
- Make it possible to infer the layout by the number of unique values in each group. I think a natural way to accomplish this would be with the syntax
@df school density(:MAch, layout = (:Sx, :Sector), link = :all)
But I can imagine that both of these would be somewhat difficult to integrate into the existing grouping machinery. And thanks for the pointer to AoG!