Michael Krabbe Borregaard
Michael Krabbe Borregaard

Hi, I just fell over this package and it looks super sweet. It would be nice to integrate it into my work flow. Using it caused an exception, though, and...
It should be possible, and fairly easy, to make a userplot recipe for facet-grids, similar to subplot_grid in Gadfly, or facetgrid in ggplot2.
When I ```julia gr() plot(sin); plot(cos, reuse = false) ``` it still reuses the window. On plotlyjs it opens a new electron window, doesn't plot to it, then hangs indefinitely....
As discussed with @andreasnoack on Slack, https://julialang.slack.com/archives/C6821M4KE/p1527711673000076 , making it possible to pass a matrix as weights would make it possible to do GLS with the GLM package. Given that...
In statistical analysis, e.g. with DataFrames.jl, it is a convention that columns equal variables, rows equal observations. The same is true for the entire R analytical ecosystem (statistics + machine...
I guess it's really a Tokenize.jl thing.
AlgebraOfGraphics don't seem to handle missing values the same as Makie. Consider 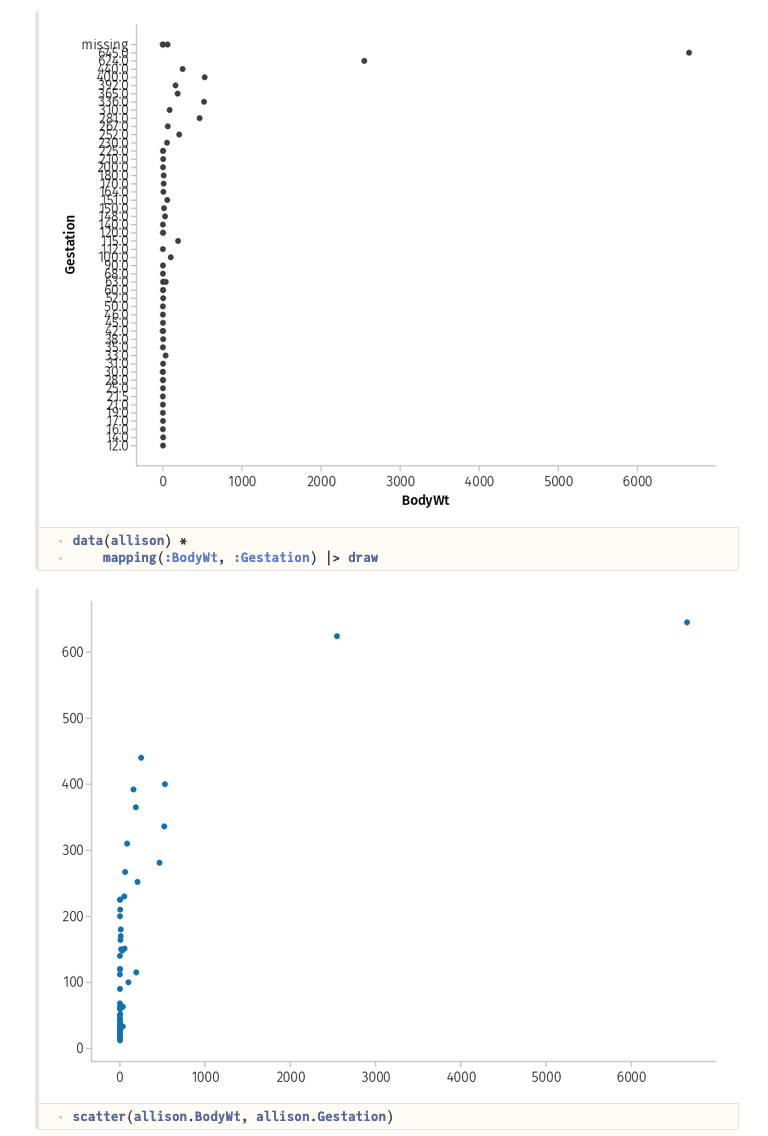 Using `dropmissing` on the full DataFrame is not viable, as the missings...
The syntax in AOG seems to be (I might be wrong here) that things that vary according to data go in `mapping` whereas things that you specify explicitly (fillcolor etc)...
Some of the graph algorithms take a long time to run when the graphs are complex. It's annoying to have to recalculate every time you want to change nodesize etc....
@JackDevine does this repo want a recipe for call trace graphs? Based on https://gist.github.com/mkborregaard/81825c3d370bb4d8dbfe59c3b2ae4b33 but I don't really have the best interface yet. Probably a `@userplot` like `tracegraph(modules, call, args...)`,...