jwittlincohen
jwittlincohen
I'm seeing the same on 0.3.0-rc2 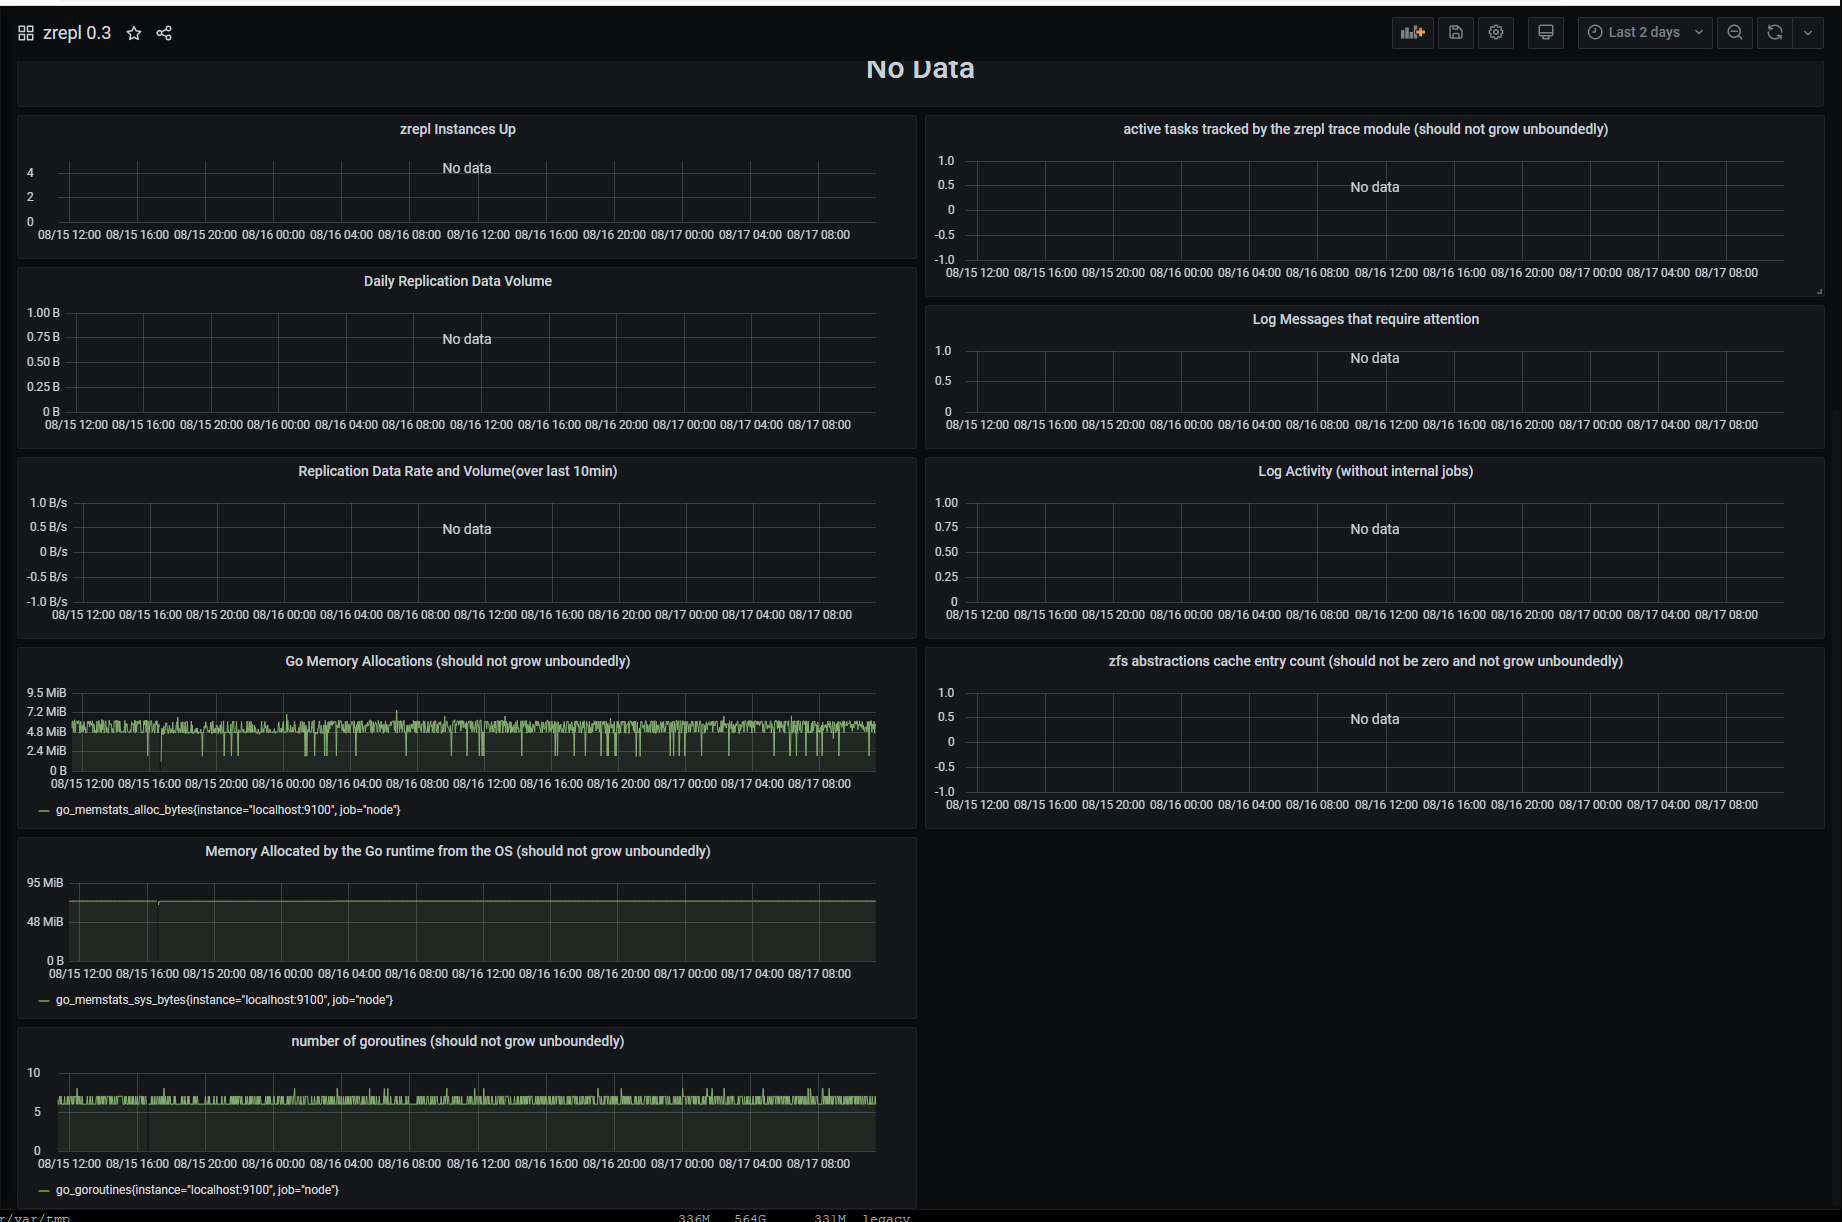
@problame Many replications have been performed. For example, I have the below job set to replicate the selected datasets every 10 minutes. ``` Job: rpool-server-rootfs Type: push Replication: Attempt #1...
@problame It seems the issue is that Grafana isn't successfully adding the Prometheus source for zrepl. Grafana is running on the same system and sees the main Prometheus source at...
Yup, my mistake. For anyone hitting the same issue, you need to modify `/etc/prometheus/prometheus.yml` to scrape the information from zrepl at localhost:9091. Then restart prometheus and the dashboard should work...
@problame Sure, should I assume that the user already has Grafana and Prometheus installed and functional aside from the changes required to get Prometheus to scrape the metrics from zrepl,...
I thought this behavior was expected. The `compressratio `appears to be based off psize without accounting for padding. For example, if you're using ashift=12, the smallest possible block size on...
If you don’t specify an ashift value, ZFS will use the reported physical block size of the disks in the pool. Most hard drives larger than 4TB now use a...
It appears that utilizing L2ARC with `zfs_compressed_arc_enabled = 0 `results in a kernel panic - #8454
That's unfortunate. Thanks for the information!