Fabian Greimel
Fabian Greimel
> Actually, do you know how I'd add a legend to this that tells users what each band means? (e.g. light yellow=68%, dark yellow = 95%, very dark = 99%)...
I don't fully understand what the code does. But what happens if you use color for grouping but there happens to be just one group? (In my opinion, the legend...
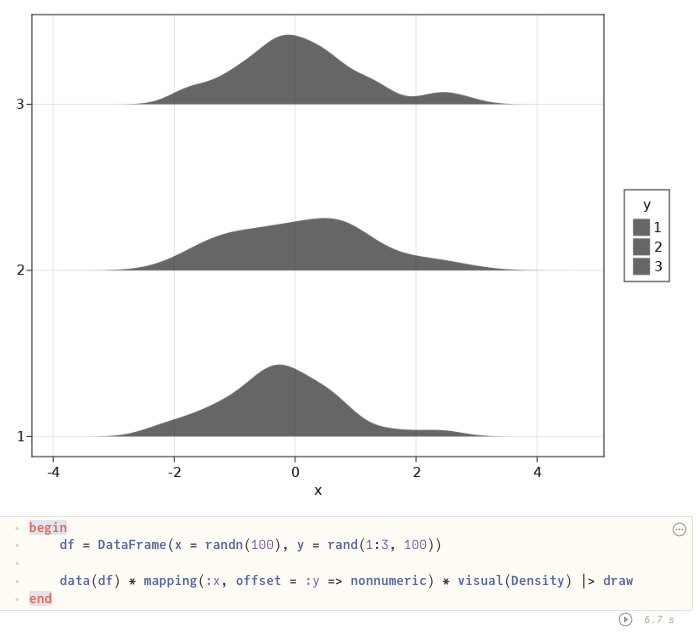 ```julia begin df = DataFrame(x = randn(100), y = rand(1:3, 100)) data(df) * mapping(:x, offset = :y => nonnumeric) * visual(Density) |> draw end ```
Oh, great, you figured it out already.
Probably @piever knows better, but it somehow cycles over attributes. So there either is a palette [1, 2, 3, ...] for the offset keyword of `Density`, or it falls back...
Automatic decimation would be great! Could you make it dependent on the size of the bounding box? Say, skip points unless they are more than `box_size .* 0.01` away from...
I've been looking for the same functionality. You have two cases in mind. The one with where `arr ⊆ [1,2]` works like this. ```julia CategoricalArray{String,1}( arr, CategoricalPool(Dict("female" => 2, "male"...
This, however, will not work together with faceting. There should be such an option that works even when faceting.
You can do ```julia data(df) * mapping(:x,:y) * visual(Lines) * mapping(color=:col, group=:col => nonnumeric) |> draw ```
Should we put this example of using `group` with `Lines` to the gallery, @piever?