AlgebraOfGraphics.jl
 AlgebraOfGraphics.jl copied to clipboard
Using a Colorbar for categorical data OR forcing grouping for continuous data
Consider a data frame with three columns: x value, y value, color.
using DataFrames, AlgebraOfGraphics, CairoMakie
x = [1,2,3,4]
y0 = [1,2,3,4]
y1 = y0.+1
df = DataFrame(x=[x;x],y=[y0;y1],color=[0,0,0,0,1,1,1,1])
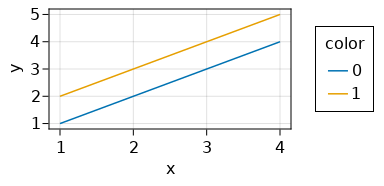
I want to make a line plot in which we have grouping into separate lines like this:
data(df) * mapping(:x,:y) * visual(Lines) * mapping(color=:color => nonnumeric) |> draw
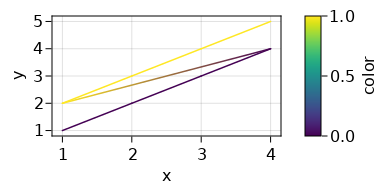
But because I have many different colors I want a continuous color scale (which here regrettably does not provide separate lines):
data(df) * mapping(:x,:y) * visual(Lines) * mapping(color=:color) |> draw
Basically, each line is guaranteed to have the same color (so categorical treatment of the color makes sense), but there are so many categories and the categories have a notion of distance between them, that they should be shown on a colorbar, not a legend.
Here is a popular type of a plot like this: https://user-images.githubusercontent.com/705248/134789512-2ad93866-013c-4ad6-ab32-5bb1a90af12f.png
So my question is: How do I force a continuous color palette and a colorbar for a categorical color mapping? Or equivalently, how do I force a grouping for a continuous color mapping?
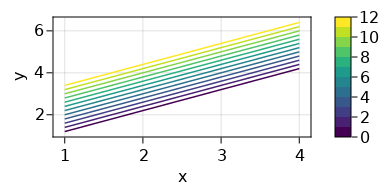
Here is a workaround, creating the colorbar manually, but it would be nice if AlgebraOfGraphics.colorbar! supported categorical variables:
f = Figure()
ax = Axis(f[1, 1])

# make mock data for 12 lines
x = vcat([[1,2,3,4] for i in 1:12]...)
y = vcat([[1,2,3,4].+i/10 for i in 1:12]...)
col = vcat([[i,i,i,i] for i in 1:12]...)
df = DataFrame(x=x,y=y,col=col)

# create layer but plot it without legends or colorbars
layer = data(df) * mapping(:x,:y) * visual(Lines)
layer *= mapping(color=:col=>nonnumeric)
colors = cgrad(:viridis, range(0,1,length=13), categorical=true)
grid = draw!(ax, layer, palettes=(color=colors,))

# manually create the colorbar
Colorbar(f[1,2], limits=(1,12), colormap=colors)
cb = legend!(f[1,2], grid)
f[1,2] = cb
f
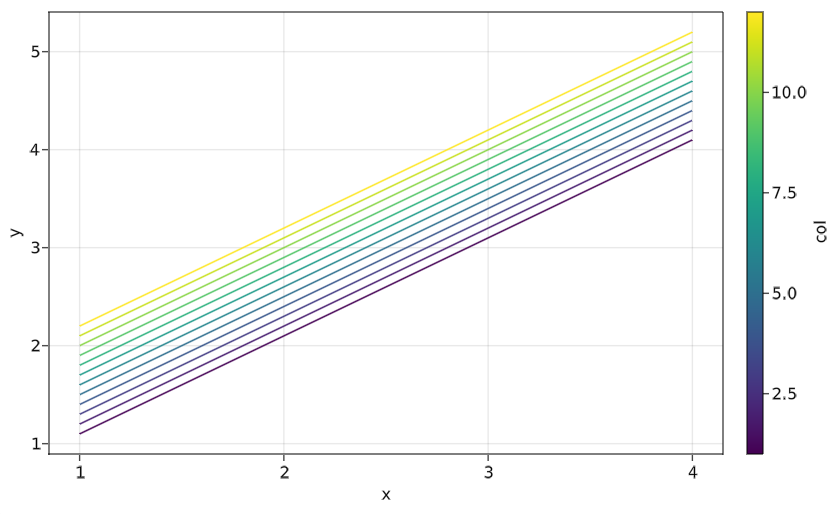
You can do
data(df) * mapping(:x,:y) * visual(Lines) * mapping(color=:col, group=:col => nonnumeric) |> draw
Oh! I failed to see the group argument from the documentation. Thank you, this was very helpful! I will leave this issue open in case any of the devs consider this as a worthwhile explicit addition to the docs (but maybe I just missed it while reading them, in which case someone else can close the issue).
Should we put this example of using group with Lines to the gallery, @piever?
@greimel, that's a smart trick, in general using group to separate lines is probably a good thing to know, definitely worth to have it in the docs