AlgebraOfGraphics.jl
 AlgebraOfGraphics.jl copied to clipboard
Scalar transformations
Problem description
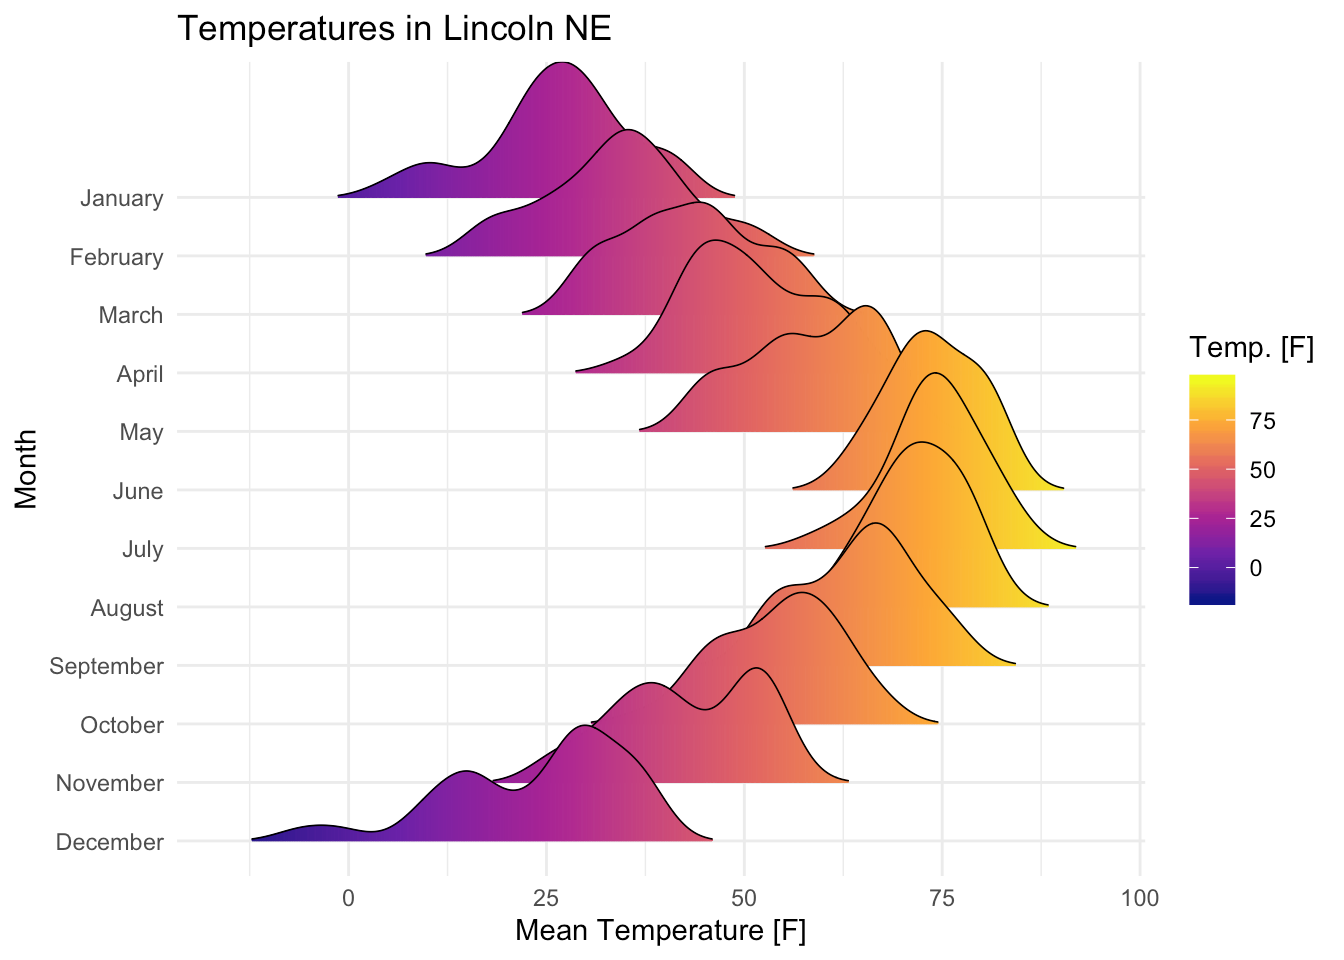
Makie's Density plot is hard to use with AoG, because It has an offset parameter that controls at what y value the density is plotted. This needs to be a scalar, by default 0. For ridgeline plots, this value needs to be set by a categorical variable, like here:
Let's say we had this DataFrame:
df = DataFrame(x = randn(100), y = rand(1:3, 100))`
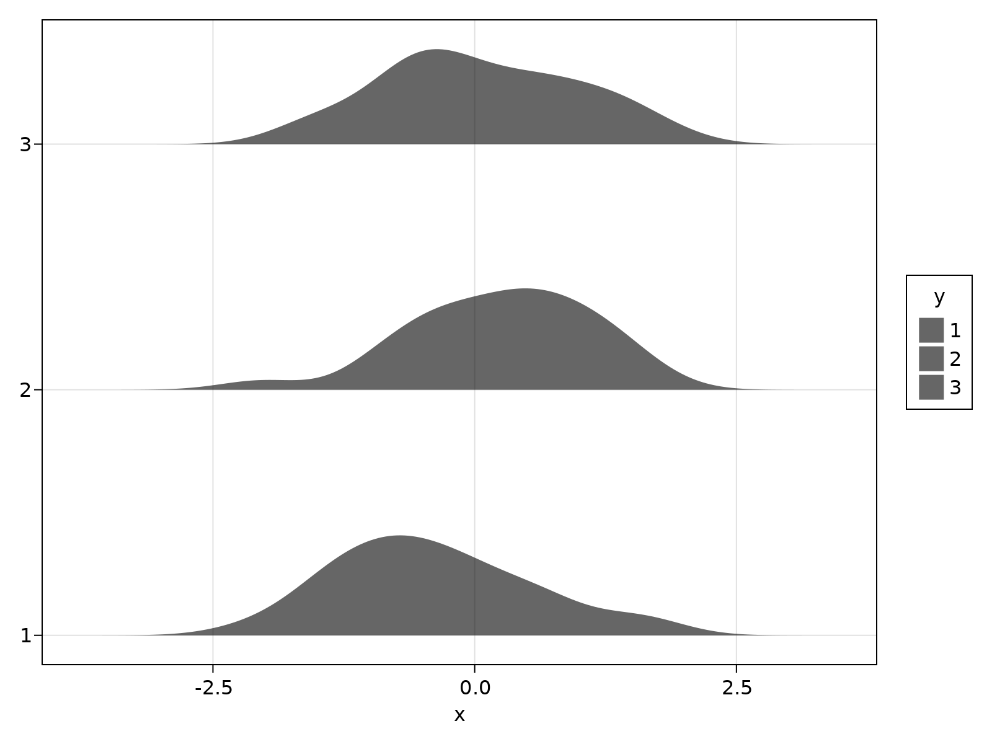
and wanted to plot something like
data(df) * mapping(:x, offset = :y)
We can't map y to offset though because we would pass 3 vectors of 1s, 2s or 3s to the attribute in each instance. So I think for this kind of scenario, there should be a way to tell AoG that a value should be used as a scalar. This could be done by default by using only(unique(x)) but even aggregations seem plausible.
Huh I'm surprised this actually works, although I'm not sure why? I kind of made this issue on the assumption that it shouldn't work, and only tried afterwards to see what the error is:
AoG.data((x = randn(100), y = rand(1:3, 100))) *
    AoG.mapping(:x, offset = :y => nonnumeric) *
    AoG.visual(Makie.Density) |> AoG.draw
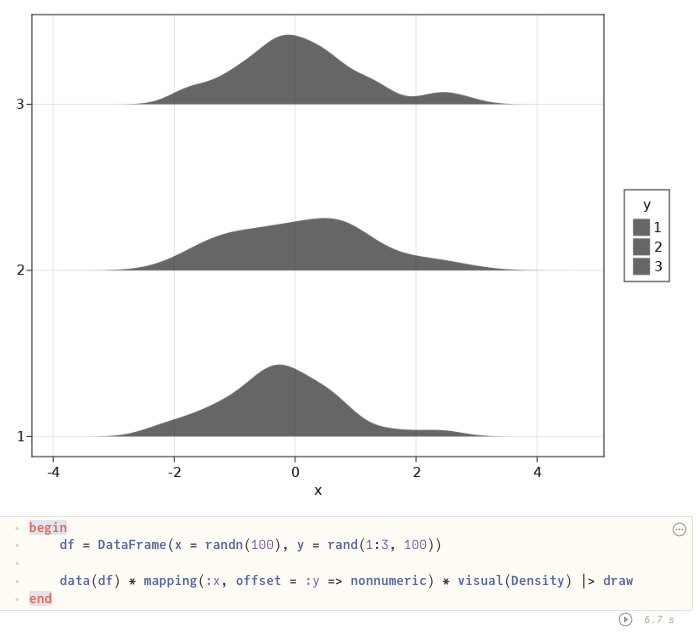
begin
	df = DataFrame(x = randn(100), y = rand(1:3, 100))

	data(df) * mapping(:x, offset = :y => nonnumeric) * visual(Density) |> draw
end
But why does it work, does nonnumeric pass scalars in the backend? Is this a general solution then and the issue can be closed?
Probably @piever knows better, but it somehow cycles over attributes. So there either is a palette [1, 2, 3, ...] for the offset keyword of Density, or it falls back to integers if there is no palette.
You can directly use labels:
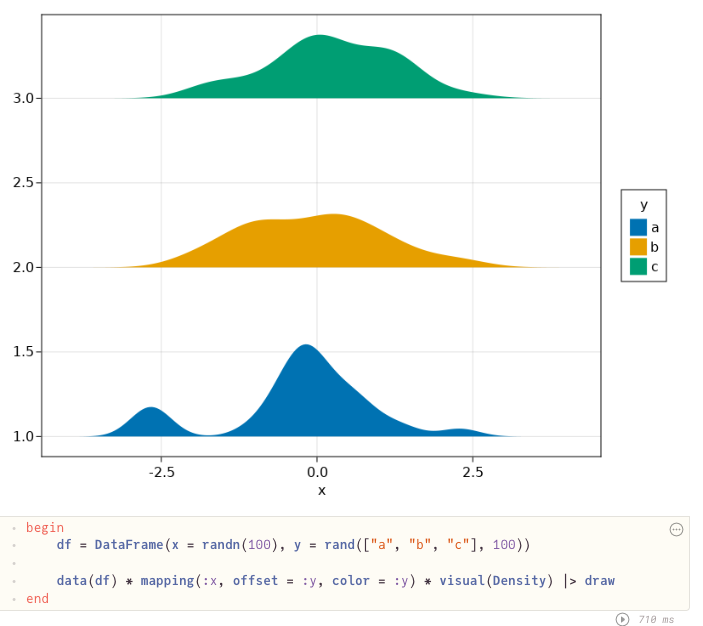
The problem here is then still that the y axis label is not set to "a", "b", "c" because AoG assumes y is always the second positional arg. But that's a different problem I guess. First I'd like to understand what arguments are actually passed to the Makie primitives.
At the moment, in the absence of a palette, the default is to pass integer values corresponding to the levels. This may not necessarily be ideal (see #300), but it is the current state of affairs. The labels are passed to the axis (for positional mappings) or to the legend (for named mapping).
offset here is a bit tricky, because it is a named argument, but really it refers to the axis. Could this have a signature similar to violin instead? (It also feels like they are somewhat redundant, as one could get this plot with violin.)
Hm yes so this is a larger problem about the api of plotting functions. Should we generalize all plotting signatures so that they work with long-format data including grouping? So violin is currently almost like density but for long-format data with groups. I don't really like having both as they are redundant as you note. I see that long-form is what AlgebraOfGraphics desires, but it might not always be the easiest for other users.
This is an important discussion to have.
I see that long-form is what AlgebraOfGraphics desires, but it might not always be the easiest for other users.
Actually, AlgebraOfGraphics doesn't really prefer the long format, as the grouping has already been done by that stage, so things get reconcatenated to form the violin plot command in Makie. For AoG, it'd be best if each group could be plotted independently, which is not the case in violin because of renormalization.
The current solution is not completely satisfactory: right now for example it's very hard to get violin plots with consistent renormalization (same area = same probability mass) across different subplots in the figure. What's the best interface for "grouped data" plots in Makie (and how AoG should interact with it) is not completely clear to me.
I don't know how Makie should represent grouped data. From the AoG side, it'd be more useful to have access to a lower-level API, where you plot group by group but pass extra arguments (like the maximum of the pdf) that need to be computed globally.
My suspicion is that plots that mix analysis and visualization (like violin) can be a bit problematic with respect to grouping and it'd be best to split this in two steps, but I don't have a clear API in mind.