sonyahanson
sonyahanson
Thanks Mehtap!
So in this plot is: `plt.hist(mcmc.DeltaG.trace(), 40, alpha=0.75, label="DeltaG = %.1f +- %.1f kT"%(DeltaG, dDeltaG))` where ``` DeltaG = map.DeltaG.value dDeltaG = mcmc.DeltaG.trace().std() ``` I chose this because it is...
Should I also change this in `show_summary`, was there a reason for choosing map there?
What does MAP add out of curiosity?
Finally made a pull request with these https://github.com/choderalab/fluorescence-assay-manuscript/pull/6 Not so bad: 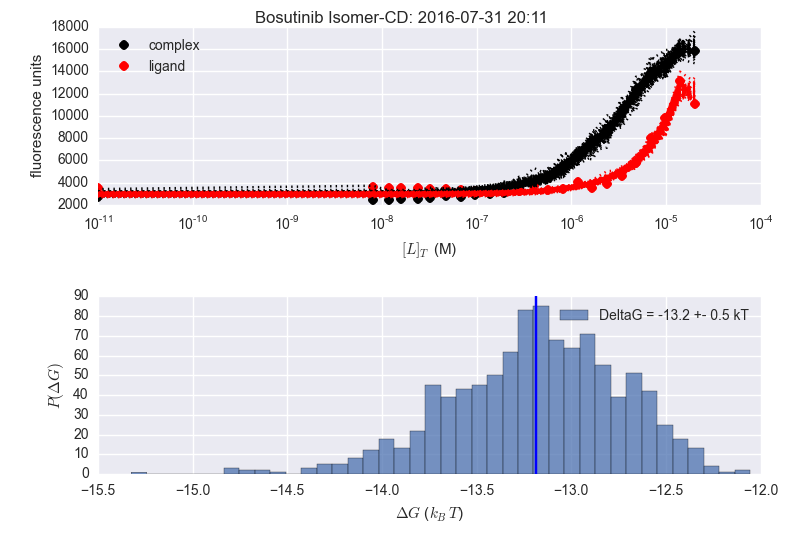 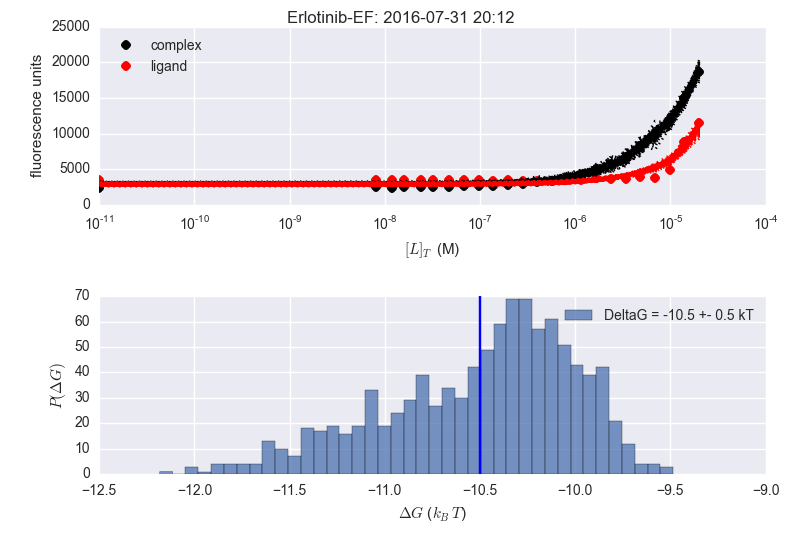
So this definitely seems to be more of a problem for the spectra assays than the singlet assays:  
Or... should we not have data in this repository at all? Just have a bare minimum for tests? We were planning on putting all the raw data for the manuscript...
I think this sounds reasonable, will shift to working in the [manuscript repo](https://github.com/choderalab/fluorescence-assay-manuscript) for the datasets relevant to that. We can revisit if this becomes stranger than expected.
I'm guessing we want to keep the files in `data/full_example/`, but maybe move everything to the `examples` directory. Maybe you can do this in your PR @jchodera ?
So after discussing with @MehtapIsik, it seems like it is a good idea to make a new branch, e.g. `assaytools/July2016` that could keep all the data and notebooks relatively as...