plot
 plot copied to clipboard
A concise API for exploratory data visualization implementing a layered grammar of graphics

We support ordinal color scales: ```js Plot.legend({color: {type: "ordinal", domain: d3.range(10)}}) ``` But trying to do the same with an opacity scale results in an error: ``` Error: ordinal opacity...
Quick take on #1164. 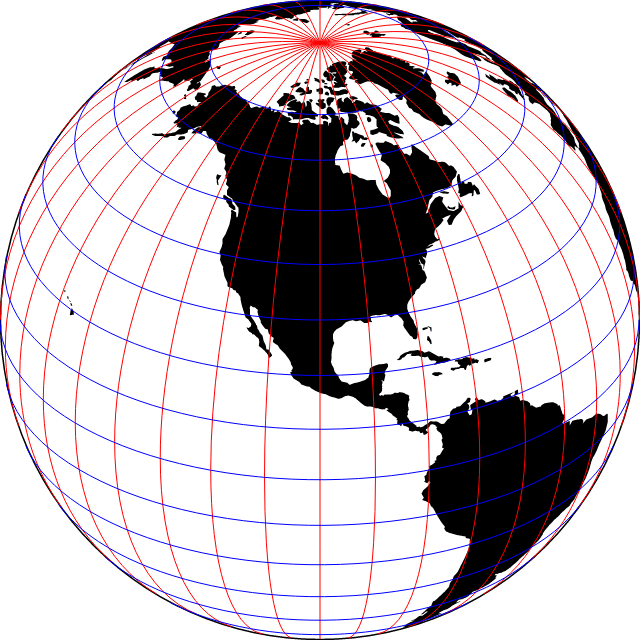 ```js Plot.plot({ projection: { type: "orthographic", rotate: [100, -30] }, marks: [ Plot.sphere(), Plot.geo(land, {fill: "currentColor"}), Plot.ruleX(d3.range(-180, 180, 10), {stroke: "red"}), Plot.ruleY(d3.range(-80, 80, 10), {stroke:...
Hi! Would it be possible to export the type expected by the geo mark? This would be helpful when working with TypeScript. From what I understand, we currently need to...
Aims to fix https://github.com/observablehq/plot/issues/2274 This PR allows the `render` function of tooltips (`Tip`) to handle `null` values for a `title`. See the issue linked above for steps to reproduce the...
Encountered through trying to make a `Plot.geo` choropleth that resembles the following: ```ts Plot.plot({ marks: [ Plot.geo(countries, { title: (d) => d.properties.user_data != 0 ? `Fun property: ${d.properties.user_data}` : null,...
A great feature would be allowing `null`/`undefined` titles for tooltips to prevent the tooltip from being rendered. I'm too new to Plot to suggest a way of implementing this, though....
Currently when *z* is specified as `stroke: {value: "series"}`, it is ignored by the window (map) transform and we get the incorrect chart. | correct | incorrect | |--|--| |...
- [x] unit: auto (closes #2214) - [x] #2132 (merge commit, closes https://github.com/observablehq/plot/issues/2129) - [x] #2204 (merge commit closes https://github.com/observablehq/plot/issues/2186)
Metadata
Owner
Metadata
A concise API for exploratory data visualization implementing a layered grammar of graphics