projected rules
Quick take on #1164.
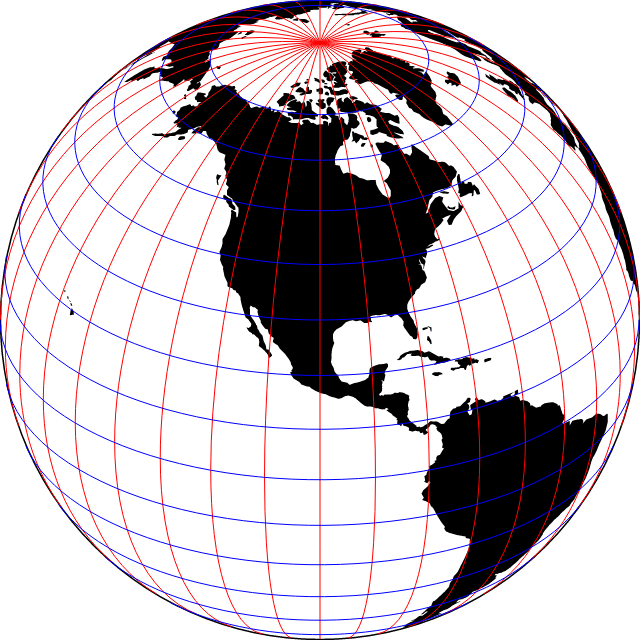
Plot.plot({
  projection: {
    type: "orthographic",
    rotate: [100, -30]
  },
  marks: [
    Plot.sphere(),
    Plot.geo(land, {fill: "currentColor"}),
    Plot.ruleX(d3.range(-180, 180, 10), {stroke: "red"}),
    Plot.ruleY(d3.range(-80, 80, 10), {stroke: "blue"})
  ]
})
Some things to figure out:
- How do you turn on/off shape- vs. point-based projection (the projected option)?
- Can we assume that projections are spherical? (Probably okay?)
- Can you set the precision of the projected line?
- Can you set the opposite extent of the projected line (ruleX’s y1 and y2)?
- How do you turn on/off shape- vs. point-based projection (the projected option)?
So far none of our initializers messes with x1, y1 etc., they just touch x and y. But if the centroid initializer, for example, started to apply to these channels, we'd have a potential conflict. So it's probably a good prevention to turn this off (silently, or error?) if used with an initializer. I'm not sure if there are other weird cases.
- Can we assume that projections are spherical? (Probably okay?)
The default y1=-90 to y2=90 is okay—for a planar projection the user will have to specify y1 and y2 anyway. Though I'd prefer we default y1=-80 and y2=80.
- Can you set the precision of the projected line?
I don't think that's necessary. The maximum error happens at latitude 45° and is proportional to step^2. If the step is 1 degree (361 points per parallel), the maximal error (on Earth) is 121m, which is, I think, low enough. 0.5 degree would give use 30.3m. We can even be a bit smarter, and if you "zoom in" split the segment [x1, x2] in ⎡sqrt(360 * (1+ ⎸x2-x1⎸))⎤ parts or something similar, to get even more precision without adding points.
- Can you set the opposite extent of the projected line (ruleX’s y1 and y2)?
I've added this.
As more high-level remark, I don't think I'd often reach for a "rule X" to draw a single meridian. What we need most often is a graticule (or subset of a graticule), which sounds more like gridX + gridY. In the tests here we use ruleX(d3.range(-180, 180)), a pretty good indication that we want a gridX. We've also talked about adding lon and lat information on the "sides" of the map, which sounds like an axisX/axisY mark.
Yes. Maybe the way to think about this is: how could we add an automatic graticule/sphere when a spherical projection is in use, similar to how we can add automatic axes for planar coordinate systems?