marsej
marsej
This could be enhanced with some sort of "debug selected projects only" so that when breaking with say global break (eg.pause-break key) the debugger would land to code in the...
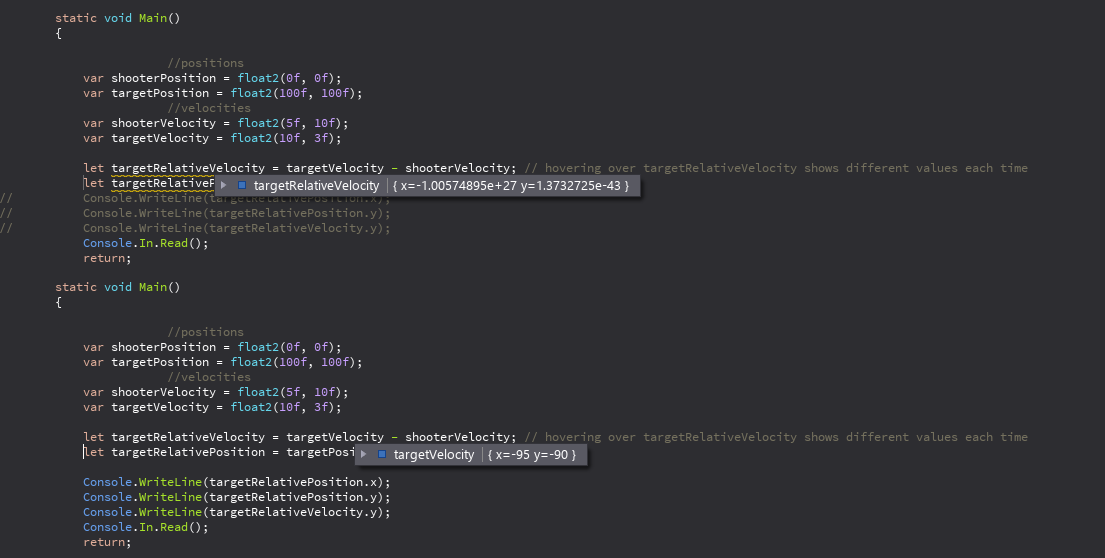
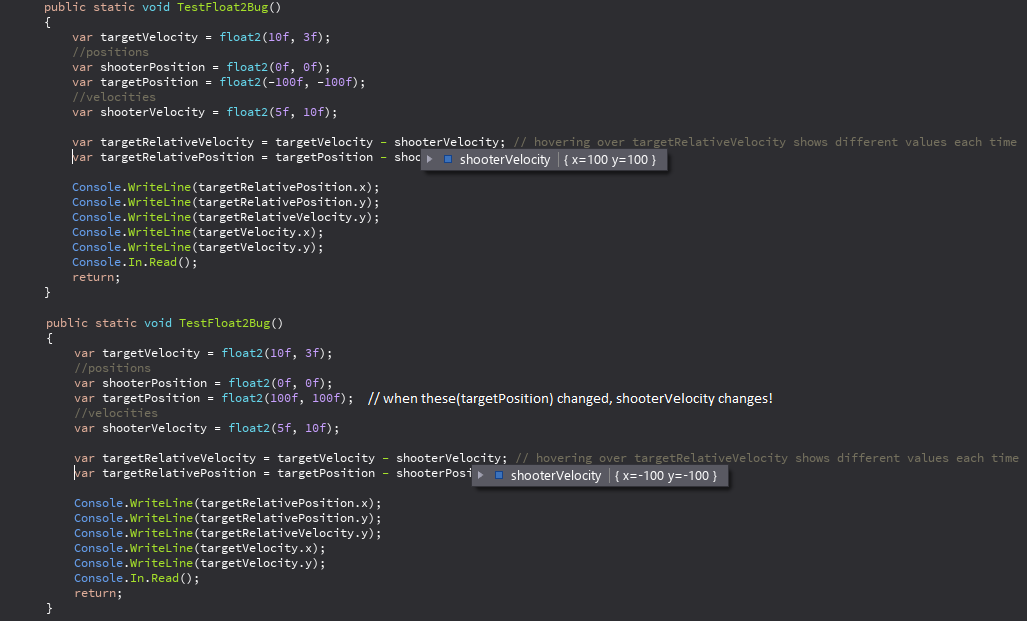
In 0.43.1 the result has improved but there still are cases where the return value is not shown: ``` BeefLibs\corlib\src\Platform.bf: public static extern int32 BfpProcess_GetProcessId(BfpProcess* process); BeefLibs\corlib\src\Diagnostics\Process.bf public int32 Id...
At least in C# w/ Windows there's some special cases that need to be handled when doing that from C#, if you want it to work in every case. Some...
This isn't about stepping but tracing(and then adding bp's), similar to in OllyDbg or perhaps I didn't understand what you meant.
OllyDbg has Stack Trace, Run trace, Log windows which each do different things. With unknown code/difficult cases those other windows help. For instance you could "animate over" code which then...
I had an idea for a workaround: Use Find and Replace to replace every "{" with "{ CallerInfo(); " Where CallerInfo is: ```cs public static void CallerInfo(String member = Compiler.CallerMemberName,...
I actually need it for .cpp (for finding code paths for buggy and non-buggy cases). I found this: ``` printf("%s\n", __func__); ``` That prints "main" when in main(); EDIT: even...
I got the manual tracing working: None of the other project configurations worked except for Release-x64 in the Beef.sln file (compiled then attached VS manually to BeefIDE.exe EDIT: Changing startup...
I did some testing and looks like just setting a breakpoint first line of code in Main and using the profiler to check time passed seems good enough, however being...