李国忠
> The [Prometheus remote-write exporter](https://github.com/open-telemetry/opentelemetry-go-contrib/tree/master/exporters/metric/cortex) _is_ part of this project. It is hosted in the contrib repo. Am I missing something in your request? This is a cortex exporter, not...
> I have moved this issue to the https://github.com/open-telemetry/opentelemetry-go-contrib repository. > > The exporter, while named "cortex" is indeed intended to support the Prometheus remote write protocol generally. This is...
https://grafana.com/docs/loki/latest/clients/promtail/stages/metrics/#metric_gauge https://docs.fluentbit.io/manual/stream-processing/getting-started/fluent-bit-sql
grpc timeout ??? vendor/github.com/grafana/dskit/grpcclient/grpcclient.go:98 level=warn ts=2022-01-24T10:57:05.273457211Z caller=grpc_logging.go:55 method=/logproto.Querier/Query duration=16.524312361s err="failed to get s3 object: RequestCanceled: request context canceled\ncaused by: context canceled" msg="gRPC\n" 
This error is an expected log. When the limit is 1000, the context will automatically cancel after 1000 logs are queried.
> Hi there @liguozhong. If this is an expected log is there any discussion to update the error to warning or change the message? good idea.
``` - match: selector: '{job="varlogs"} |~="error|Error|ERROR"' stages: - regex: expression: '^.*(?P(error|Error|ERROR)).*$' - template: source: log_level template: 'error' - labels: log_level: ``` I took a look, the “match” in the promtail...
Hi, I spent 1 year debugging the slow logql problem through tracing system. I have some experience you can refer to. The performance of '| json' expr is too slow,...
` split_queries_by_interval: 15m ` Another supplementary point, if you do not have enough querier instances, or do not configure a large enough 'max_querier_per_tenant' value, this configuration will cause 7~30 days...
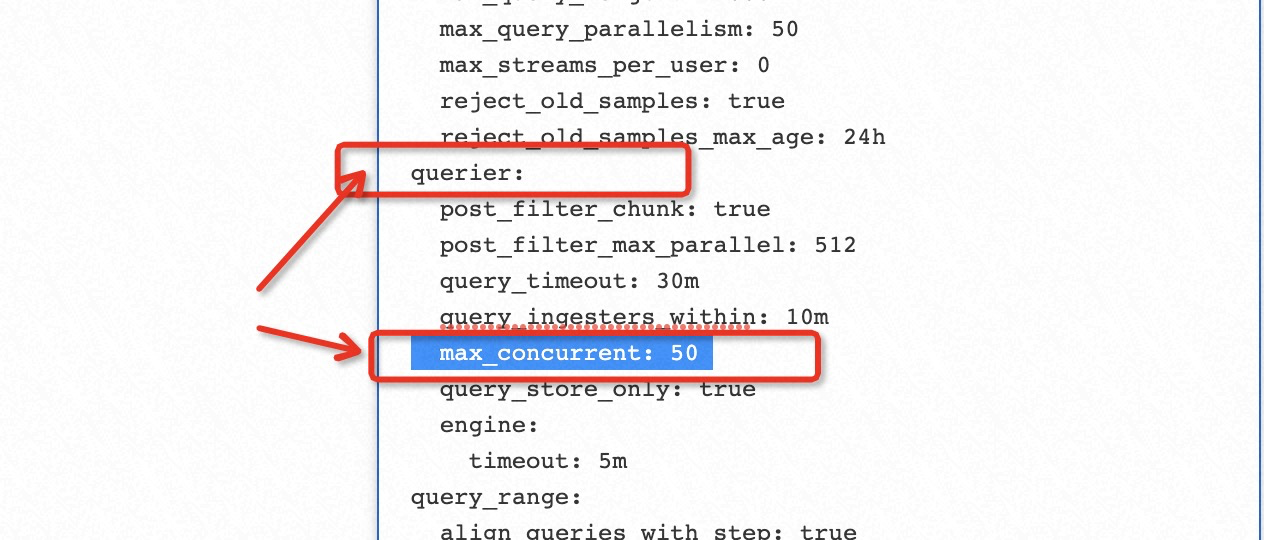  increase ‘max_query_parallelism’ and ‘max_concurrent’ add ’split_queries_by_interval‘ split_queries_by_interval:15m ,Your current configuration needs to split the query into a huge query load and parallelism. you need to show more error...