loki failing when querying huge data
Hello,
loki querier is failing with the below when trying to pull logs (for example: last 30 days)
504 Gateway Time-out
We are running distributed set up with 4 querier pods each with 4Gi ram. when I try pull log data for 30days, seeing an error message on grafana. I have increased timeouts on nginx proxy that is between loki and grafana, still it didn't help.
On the other hand, when I try to pull for shorter periods and gradually increase it 30 days, able to see the logs. for example, I will start with 7 days, and then 12-14 days and then 20-25 days and in the end for 30 days. This way I could pull the logs, not sure if these are being cached in querier.
While our intention of testing loki is to replace ELK, but unless I would be able to atleast pull the data with timeouts, cannot completely switch from ELK.
Do you have any ideas/suggestions on fixing this?
Thanks Eswar
:wave: it is not uncommon to hit a timeout. What does your query look like? Could you narrow the search with more labels?
Hi team, we have the same issue with loki and gw timeout.
We have our own-hosted s3 (ceph) and rather huge number of logs ( for example 40-50Gi per day). We try to look 3h with easiest request (i.e {pod_labels_app=~"api-green|api-blue"} |= 'site.com' ) and get timeout after the 3-4 mins.
<html> <head><title>504 Gateway Time-out</title></head> <body> <center><h1>504 Gateway Time-out</h1></center> <hr><center>nginx</center> </body> </html> <!-- a padding to disable MSIE and Chrome friendly error page --> <!-- a padding to disable MSIE and Chrome friendly error page --> <!-- a padding to disable MSIE and Chrome friendly error page --> <!-- a padding to disable MSIE and Chrome friendly error page --> <!-- a padding to disable MSIE and Chrome friendly error page --> <!-- a padding to disable MSIE and Chrome friendly error page -->
Try to understand what we do wrong..
our loki-distributed values file loks like:
# Values: https://github.com/grafana/helm-charts/tree/main/charts/loki-distributed
---
loki:
  structuredConfig:
    auth_enabled: false
    analytics:
      reporting_enabled: false
    chunk_store_config:
      max_look_back_period: 0s
    compactor:
      shared_store: filesystem
      # shared_store: aws
      working_directory: /var/loki/boltdb-shipper-compactor
    distributor:
      ring:
        kvstore:
          store: memberlist
    frontend:
      compress_responses: true
      log_queries_longer_than: 5s
      tail_proxy_url: http://loki-loki-distributed-querier:3100
    frontend_worker:
      frontend_address: loki-loki-distributed-query-frontend:9095
    ingester:
      chunk_block_size: 262144
      chunk_encoding: snappy
      chunk_idle_period: 30m
      chunk_retain_period: 1m
      lifecycler:
        ring:
          kvstore:
            store: memberlist
          replication_factor: 1
      max_transfer_retries: 0
      wal:
        dir: /var/loki/wal
    limits_config:
      enforce_metric_name: false
      max_cache_freshness_per_query: 10m
      reject_old_samples: true
      reject_old_samples_max_age: 168h
      split_queries_by_interval: 15m
    memberlist:
      join_members:
      - loki-loki-distributed-memberlist
    query_range:
      align_queries_with_step: true
      cache_results: true
      max_retries: 5
      results_cache:
        cache:
          enable_fifocache: true
          fifocache:
            max_size_items: 1024
            validity: 24h
    ruler:
      alertmanager_url: https://alertmanager.xx
      external_url: https://alertmanager.xx
      ring:
        kvstore:
          store: memberlist
      rule_path: /tmp/loki/scratch
      storage:
        local:
          directory: /etc/loki/rules
        type: local
    schema_config:
      configs:
      - from: "2022-07-11"
        store: boltdb-shipper
        object_store: s3
        schema: v11
        index:
          prefix: loki_index_
          period: 24h
        # object_store: filesystem
    server:
      http_listen_port: 3100
      grpc_server_max_recv_msg_size: 24194304
      grpc_server_max_send_msg_size: 24194304

    storage_config:
      boltdb_shipper:
        active_index_directory: /var/loki/boltdb-shipper-active
        cache_location: /var/loki/boltdb-shipper-cache
        cache_ttl: 24h
        shared_store: s3
      aws:
        insecure: true
        s3: https://[path]/storage-prod
        s3forcepathstyle: true
        http_config:
          idle_conn_timeout: 90s
          response_header_timeout: 0s
          insecure_skip_verify: true

      # boltdb_shipper:
      #   active_index_directory: /var/loki/index
      #   cache_location: /var/loki/cache
      #   cache_ttl: 168h
      #   shared_store: filesystem
      # filesystem:
      #   directory: /var/loki/chunks
    table_manager:
      retention_deletes_enabled: false
      retention_period: 0s


queryFrontend:
  replicas: 3
compactor:
  persistence:
    enabled: true
    size: 100Gi
indexGateway:
  enabled: true
  persistence:
    enabled: true
    size: 100Gi
ingester:
  persistence:
    enabled: true
    size: 100Gi
querier:
  persistence:
    enabled: true
    size: 100Gi
ruler:
  persistence:
    enabled: true
    size: 100Gi
thanks for your reply.
I have only three labels in the my config
labels instance=$kubernetes['pod_name'],env=$env,app=$app
My query looks like:
{env="prod",app="reading-metadata"} | json |= "log=error"
what I want to achieve? while analysing issues, sometimes I might have to search with certain text(metadata related to the project) and may have to go back as long as 30 days.
Added to this , we ship ~20GB of data daily. to the s3 storage.
Hi, I spent 1 year debugging the slow logql problem through tracing system. I have some experience you can refer to.
The performance of '| json' expr is too slow, you can pre-filter some logs by '|'
{env="prod",app="reading-metadata"} |= "error"| json |= "log=error"
If the performance is still too slow, you can also speed up the query by replacing 'json' with 'regex'
{env="prod",app="reading-metadata"} |= "error"| | regexp "log":(?P|= "log=error"
If it's still too slow, in addition to adding more machines, you can also try my branch, which is designed to solve the problem of grep being too slow https://github.com/grafana/loki/pull/5455
split_queries_by_interval: 15m
Another supplementary point, if you do not have enough querier instances, or do not configure a large enough 'max_querier_per_tenant' value, this configuration will cause 7~30 days logql to become very slow.
Hi team, we have the same issue with loki and gw timeout.
We have our own-hosted s3 (ceph) and rather huge number of logs ( for example 40-50Gi per day). We try to look 3h with easiest request (i.e {pod_labels_app=~"api-green|api-blue"} |= 'site.com' ) and get timeout after the 3-4 mins.
<html> <head><title>504 Gateway Time-out</title></head> <body> <center><h1>504 Gateway Time-out</h1></center> <hr><center>nginx</center> </body> </html> <!-- a padding to disable MSIE and Chrome friendly error page --> <!-- a padding to disable MSIE and Chrome friendly error page --> <!-- a padding to disable MSIE and Chrome friendly error page --> <!-- a padding to disable MSIE and Chrome friendly error page --> <!-- a padding to disable MSIE and Chrome friendly error page --> <!-- a padding to disable MSIE and Chrome friendly error page -->Try to understand what we do wrong..
our loki-distributed values file loks like:
# Values: https://github.com/grafana/helm-charts/tree/main/charts/loki-distributed
---
loki:
  structuredConfig:
    auth_enabled: false
    analytics:
      reporting_enabled: false
    chunk_store_config:
      max_look_back_period: 0s
    compactor:
      shared_store: filesystem
      # shared_store: aws
      working_directory: /var/loki/boltdb-shipper-compactor
    distributor:
      ring:
        kvstore:
          store: memberlist
    frontend:
      compress_responses: true
      log_queries_longer_than: 5s
      tail_proxy_url: http://loki-loki-distributed-querier:3100
    frontend_worker:
      frontend_address: loki-loki-distributed-query-frontend:9095
    ingester:
      chunk_block_size: 262144
      chunk_encoding: snappy
      chunk_idle_period: 30m
      chunk_retain_period: 1m
      lifecycler:
        ring:
          kvstore:
            store: memberlist
          replication_factor: 1
      max_transfer_retries: 0
      wal:
        dir: /var/loki/wal
    limits_config:
      enforce_metric_name: false
      max_cache_freshness_per_query: 10m
      reject_old_samples: true
      reject_old_samples_max_age: 168h
      split_queries_by_interval: 15m
    memberlist:
      join_members:
      - loki-loki-distributed-memberlist
    query_range:
      align_queries_with_step: true
      cache_results: true
      max_retries: 5
      results_cache:
        cache:
          enable_fifocache: true
          fifocache:
            max_size_items: 1024
            validity: 24h
    ruler:
      alertmanager_url: https://alertmanager.xx
      external_url: https://alertmanager.xx
      ring:
        kvstore:
          store: memberlist
      rule_path: /tmp/loki/scratch
      storage:
        local:
          directory: /etc/loki/rules
        type: local
    schema_config:
      configs:
      - from: "2022-07-11"
        store: boltdb-shipper
        object_store: s3
        schema: v11
        index:
          prefix: loki_index_
          period: 24h
        # object_store: filesystem
    server:
      http_listen_port: 3100
      grpc_server_max_recv_msg_size: 24194304
      grpc_server_max_send_msg_size: 24194304

    storage_config:
      boltdb_shipper:
        active_index_directory: /var/loki/boltdb-shipper-active
        cache_location: /var/loki/boltdb-shipper-cache
        cache_ttl: 24h
        shared_store: s3
      aws:
        insecure: true
        s3: https://[path]/storage-prod
        s3forcepathstyle: true
        http_config:
          idle_conn_timeout: 90s
          response_header_timeout: 0s
          insecure_skip_verify: true

      # boltdb_shipper:
      #   active_index_directory: /var/loki/index
      #   cache_location: /var/loki/cache
      #   cache_ttl: 168h
      #   shared_store: filesystem
      # filesystem:
      #   directory: /var/loki/chunks
    table_manager:
      retention_deletes_enabled: false
      retention_period: 0s


queryFrontend:
  replicas: 3
compactor:
  persistence:
    enabled: true
    size: 100Gi
indexGateway:
  enabled: true
  persistence:
    enabled: true
    size: 100Gi
ingester:
  persistence:
    enabled: true
    size: 100Gi
querier:
  persistence:
    enabled: true
    size: 100Gi
ruler:
  persistence:
    enabled: true
    size: 100Gi
@liguozhong @jeschkies Team, could you please take a look into my config and give some advice? Don't want to create new issue, because the problem is the same -- too long query for s3 logs. Scaled queriers up to 12 pods. They eat ~2Gb ram while search. Split them from index gateway. Added 3 query frontends.. No lucky. The query for 3 hours got down with 504 Gateway timeout :( Yes, we have rather many logs (~30G per day). Logs aren't json or something like this.. plain lines. sometimes - long lines. I have no ideas how to improve it. S3 based on Ceph with SSD, so rather fast disks. Haven't seen any issues with network (there are balancers pool before S3). No errors in log, except logs on frontend:
level=info ts=2022-09-07T13:39:50.815911581Z caller=handler.go:174 org_id=fake msg="slow query detected" method=GET host=loki-loki-distributed-query-frontend.services.svc.cluster.local:3100 path=/loki/api/v1/query_range time_taken=37.116422835s param_end=1662425999000000000 param_limit=1000 param_query="{pod_labels_app=~\"api-green|api-blue\"} |~ `.*OK`" param_start=1662411600000000000 param_step=10000ms param_direction=backward
Want to add that if you search logs without filter, I mean query like {pod_labels_app=~"api.*"} - it works for 24h examples, but returned 504 for volumes (check screen)

But if I we add something like {pod_labels_app=~"api.*"}|= "text" - it leads to full timeout(
@yaroslavkasatikov may i know if you running this kubernetes, could you let me know the replicas and resources you are provisioned for the stack.
@liguozhong still no luck. increased resources and still seeing the same error. while it is true that this could not be compared with ELK, but as we want to replace ELK with loki, atleast want to run the query to success. search criteria differs. unless, this doesn't throw 50* errors, cannot use this completely to replace ELK.
Also, for kubernetes distributed setup, do you have any suggestions on the replicas/resources?
below is the config loki config file. anything to improve.
`
auth_enabled: false compactor: shared_store: s3 working_directory: /data/compactor compaction_interval: 10m retention_enabled: true retention_delete_delay: 2h retention_delete_worker_count: 150 compactor_ring: kvstore: store: memberlist distributor: ring: kvstore: store: memberlist frontend: compress_responses: true log_queries_longer_than: 27s frontend_worker: frontend_address: loki-query-frontend:9095 grpc_client_config: max_send_msg_size: 17179869184 # 16GiB querier: engine: timeout: 3m max_look_back_period: 40s query_timeout: 2m query_ingesters_within: 1s ingester: flush_check_period: 30s flush_op_timeout: 3m concurrent_flushes: 64 chunk_block_size: 15728640 chunk_encoding: lz4 chunk_idle_period: 1m chunk_retain_period: 0m max_chunk_age: 5m lifecycler: ring: kvstore: store: memberlist replication_factor: 1 max_transfer_retries: 0 wal: dir: /data/loki/wal limits_config: max_entries_limit_per_query: 0 ingestion_rate_strategy: global reject_old_samples: true ingestion_rate_mb: 100 ingestion_burst_size_mb: 100 max_cache_freshness_per_query: 1m creation_grace_period: 1m enforce_metric_name: false split_queries_by_interval: 15m memberlist: join_members: - loki-memberlist query_range: align_queries_with_step: true parallelise_shardable_queries: true cache_results: true max_retries: 5 results_cache: cache: enable_fifocache: true fifocache: max_size_items: 1024 validity: 24h memcached_client: host: ${PROJECT_NAME}-memcached-frontend.${ENVIRONMENT}.svc.k3s-test.local service: http ruler: alertmanager_url: ${ALERTMANAGER_URL} ring: kvstore: store: memberlist rule_path: /var/loki/rules-tmp storage: local: directory: /loki/rules type: local enable_api: true enable_alertmanager_v2: true enable_sharding: true
  alertmanager_client:
    basic_auth_username: "${ALERTMANAGER_USERNAME}"
    basic_auth_password: "$${q}{ALERTMANAGER_PASSWORD}"
schema_config:
  configs:
    - index:
        period: 24h
        prefix: loki_index_
      object_store: s3
      schema: v11
      store: boltdb-shipper
server:
  http_listen_port: 3100
  log_level: info
  grpc_server_max_recv_msg_size: 10485760000
  grpc_server_max_send_msg_size: 10485760000
  http_server_write_timeout: 10m
  http_server_read_timeout: 10m
  http_server_idle_timeout: 10m
  graceful_shutdown_timeout: 2m
tracing:
  enabled: false
storage_config:
  boltdb_shipper:
    active_index_directory: /data/loki/index
    cache_location: /data/loki/cache
    index_gateway_client:
      server_address: dns:///loki-index-gateway:9095
    shared_store: s3
  aws:
    access_key_id: ${S3_ACCESS_KEY_ID}
    bucketnames: ${S3_BUCKET_NAME}
    endpoint: https://pure-storage.pageplace.de
    s3forcepathstyle: true
    secret_access_key: $${q}{S3_SECRET_ACCESS_KEY}
    http_config:
      response_header_timeout: 5s
      insecure_skip_verify: true
  index_queries_cache_config:
    memcached:
      batch_size: 1000
      parallelism: 1000
    memcached_client:
      host: ${PROJECT_NAME}-memcached-index-queries.${ENVIRONMENT}.svc.k3s-test.local
      service: http
chunk_store_config:
  chunk_cache_config:
      memcached:
        batch_size: 1000
        parallelism: 1000
      memcached_client:
        host: ${PROJECT_NAME}-memcached-chunks.${ENVIRONMENT}.svc.k3s-test.local
        service: http
  max_look_back_period: 0s
  write_dedupe_cache_config:
      memcached:
        batch_size: 1000
        parallelism: 1000
      memcached_client:
        host: ${PROJECT_NAME}-memcached-index-writes.${ENVIRONMENT}.svc.k3s-test.local
        service: http
`

increase ‘max_query_parallelism’ and ‘max_concurrent’ add ’split_queries_by_interval‘ split_queries_by_interval:15m ,Your current configuration needs to split the query into a huge query load and parallelism.
you need to show more error log. If error log is 504 timeout, it may also say the proxy timeout of grafana's loki datasource. By default, only 30s is a very low proxy time. This grafana datasource http proxy is used to forward logql queries.
I have successfully migrated our ELK to loki. It can completely replace the original function of ELK. Loki needs to be carefully tuned and expanded.
1: grafana BI dashboard 2: alert rule 3: explore grep 4: api 5: explore OLAP
In the early stage, it took about 2 years to study the loki source code and deploy the loki cluster, and it took 9 months to migrate and offline ELK.
For the OLAP-type BI report of 30-day large query, it is recommended that you store the data to prometheus through loki's recording rule feature. loki is not very good at OLAP
If you need to pay attention to performance issues for a long time, I suggest you use the tracing system to trace the query of loki, and then cooperate with the source code of loki to see where it is slow.
Thank you for sharing your work around BI like workload on loki. I've a somehow similar usecase. I would like to store an enriched network flow data model to provide a backend for network observability. In the netflow we found, among other things:
- SrcAddr: 2^32 values (~4Billions)
- DstAddr: 2^32 values (~4Billions)
- SrcAS: 65K values
- DstAS: 65K values
- SrcPort: ~50K values (even if only few are wide used)
- DstPort: ~50K values (even if only few are wide used)
So even with only those 6 over the 50+ fields below, we have roughly a potential cardinality of ~2e+38. We can assume that t he cardinality associated with netflow flow is infinite.
I’m wondering if loki is the best tool for that from the query perspective. The ingestion is doing really great.
However the query side, from grafana. I’m unable to execute large queries such as:
rate({app="goflow2", way="egress"} | json | unwrap bytes | __error__="" [1s])
I’ve plenty of resources dedicated to each target, but they seems not used:
- 2 * query-scheduler 2 core/7GB
- 2 * query-frontend 2 core/7GB
- 20 * querier 16 core/60GB
- 4 * distributor 4 core/15GB
- 4 * ingester 16 core/60GB
I’ve been poking around the setting to get a working query, this is where I’m now. Basically I’ve increase each limit which prevent the execution of the query above. I reckon this is not the best way to use efficiently the compute resource at my disposal.
auth_enabled: False
server:
grpc_listen_address: 10.0.3.41
grpc_server_max_concurrent_streams: 1000
grpc_server_max_recv_msg_size: 80000000
grpc_server_max_send_msg_size: 80000000
http_listen_address: 10.0.3.41
http_listen_port: 3100
http_server_idle_timeout: 40m
http_server_read_timeout: 20m
http_server_write_timeout: 20m
log_format: json
log_level: debug
distributor:
ring:
instance_interface_names:
- ens4
kvstore:
prefix: loki/collectors/
store: consul
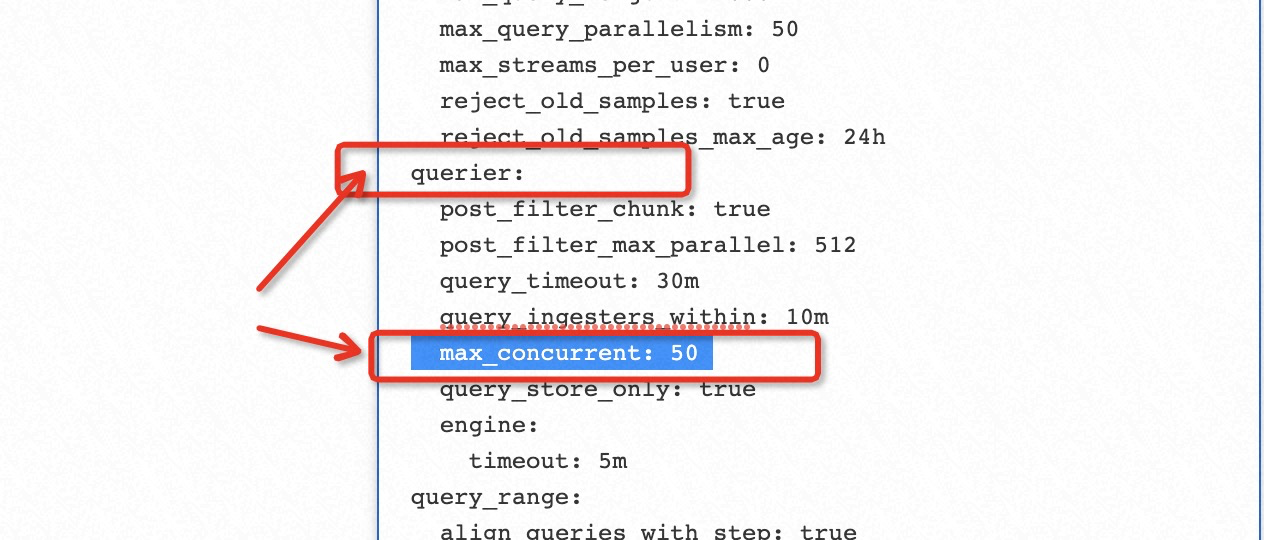
querier:
engine:
timeout: 15m
max_concurrent: 512
query_timeout: 5m
ingester_client:
grpc_client_config:
grpc_compression: snappy
max_recv_msg_size: 1048576000
max_send_msg_size: 1048576000
ingester:
lifecycler:
interface_names:
- ens4
num_tokens: 128
ring:
kvstore:
prefix: loki/collectors/
store: consul
replication_factor: 1
zone_awareness_enabled: false
storage_config:
boltdb:
directory: /var/lib/loki/index
filesystem:
directory: /var/lib/loki/chunks
schema_config:
configs:
- from: 2020-05-15
index:
period: 168h
prefix: index_
object_store: filesystem
schema: v11
store: boltdb
limits_config:
ingestion_burst_size_mb: 100
ingestion_rate_mb: 50
max_entries_limit_per_query: 20000
max_queriers_per_tenant: 40
max_query_parallelism: 5000
max_query_series: 100000000
per_stream_rate_limit: 30MB
per_stream_rate_limit_burst: 60MB
split_queries_by_interval: 5m
frontend_worker:
grpc_client_config:
grpc_compression: snappy
max_recv_msg_size: 1048576000
max_send_msg_size: 1048576000
parallelism: 64
scheduler_address: query-scheduler.loki-grpc.service.consul:9095
frontend:
compress_responses: true
grpc_client_config:
grpc_compression: snappy
max_recv_msg_size: 1048576000
max_send_msg_size: 1048576000
instance_interface_names:
- ens4
scheduler_address: query-scheduler.loki-grpc.service.consul:9095
scheduler_worker_concurrency: 16
Neither my querier nor my query-frontend seems to be busy. Am I missing something obvious in my configuration?
The queriers seems to have a hard time to reach out to the scheduler as I have the following error message: error notifying scheduler about finished query
The queriers are sending huge reponse: response larger than max message size Then rpc error: code = ResourceExhausted desc = grpc: received message larger than max (100113955 vs. 80000000) despite the fact that the queriers managed to complete the query and I’ve this message error notifying frontend about finished query
For the context, I’m running loki 2.6.1 on baremetal (one target per host) with consul for the rings. The ingestion rate is stable at 220k/sec. Once I manage to solve the querying part I will back loki with an S3-like object storage.
If you are using ebpf to monitor network requests, I recommend pre-aggregating on the agent side, and then pushing the pre-aggregated metrics to prometheus. loki is only responsible for the search of detailed logs for‘ {app="bar"}|="404"’ . metrics should be done by prometheus.
loki is not very very good at OLAP now
If you have to use loki to store ebpf network monitoring data, then you should try to improve the performance of logql. E.g
old logql
rate({app="goflow2", way="egress"} | json | unwrap bytes | __error__="" [1s])
new logql
sum(
       rate(
            {app="goflow2", way="egress"}
                  | regexp `"bytes":(?P<bytes>.*?)(,|\{|\[)`
                  | unwrap bytes
            [1m])
) by(app,way)
If you are using ebpf to monitor network requests, I recommend pre-aggregating on the agent side, and then pushing the pre-aggregated metrics to prometheus.
I cannot pre-aggregate the data as my netops team queries highly depends on the situation at hand. As such prometheus is not suited for this due to the cardinality being almost unlimited. We are investingating such tools:
- https://github.com/netobserv/flowlogs-pipeline
- https://github.com/netobserv/goflow2-loki-exporter
- https://github.com/netsampler/goflow2
In fact, I'm trying to use loki to mimic kentik features.
In you rewritten query new logql, are you using regexp parser instead of the json due to the performance issue? If that is so, do you have experience with the logfmt parser from a performance perspective?
If you are using ebpf to monitor network requests, I recommend pre-aggregating on the agent side, and then pushing the pre-aggregated metrics to prometheus.
I cannot pre-aggregate the data as my netops team queries highly depends on the situation at hand. As such prometheus is not suited for this due to the cardinality being almost unlimited. We are investingating such tools:
- https://github.com/netobserv/flowlogs-pipeline
- https://github.com/netobserv/goflow2-loki-exporter
- https://github.com/netsampler/goflow2
In fact, I'm trying to use loki to mimic kentik features.
In you rewritten query
new logql, are you using regexp parser instead of the json due to the performance issue? If that is so, do you have experience with the logfmt parser from a performance perspective?
hi, You can pre-aggregate net data through promtail's 'metrics' pipeline, and only logql's 'metrics query' will not achieve the performance you expect. https://grafana.com/docs/loki/latest/clients/promtail/stages/metrics/
logfmt parser
'logfmt parser' has no performance issues as far as I know, but 'json parser' does have lower performance.
@liguozhong Along with the applying suggestions that you have pointed out and increasing the system resoures, i am able to see gateway errors less times that earlier. for the time being, stopping it there as I have been running in to another issue.
We have elk running parallel to loki. When I compare logs lines for the same query between loki and elk , I see loki is missing/not-reporting some log lines that I can on kibana. Wanted to know, if there is any issue with loki missing some log line to ingest to ingester or querier not returning all the loglines and some other config issue?
Thanks Eswar
sum by (tenant,reason) (rate(loki_discarded_bytes_total{}[1m]))>0
It should trigger the ratelimit behavior of loki. You can check which reason through this promql, and then adjust the corresponding configuration threshold according to the reason.
more info: https://github.com/grafana/loki/pull/7145/files

@liguozhong
unfortunately, atleast in the last 24 hours, i don't see any discarded bytes after making the some changes that includes reject_old_samples: false and max_chunk_age: 120m.
I have reduced the number of streams pausing the logs from prod cluster to rule out the fact that this is not due to clogging on the network.
do you have any other suggestion?
The early loki version may have some inaccurate data bugs. What is your current loki version? In addition, I need to look at more detailed data (such as what logql is, and how long is the query time). I think it's hard to share such comprehensive data in this issue. This problem is difficult to solve in this issue.
Hi, same issue here. Loki version 2.6.1 with default configurations using distributed helm chart I increased almost every time out setting in Nginx gateway and Loki itself. My test Query: {cluster: "test"} |= "test" My traffic is 6k log per second and 50Gib log per day using Minio s3 backend Error: 504 Nginx gateway / sometimes 502 [ in 3-6 hour query ]
@liguozhong
I am running 2.61. I didn't get you completely. Are you saying that the problem is difficult to solve? While looking to find more details on the issue, I found that there are other users who are struggling with the same issue. so, this is not a issue only with my config. Only, when I started to compare the log data between Elk and Loki, I got to know of this issue.
Without fixing this, the migration would stall in my case. Do you think that this can be fixed?
this issue I think is quite similar to the https://github.com/grafana/loki/issues/4015 I also used suggestions from that issue but nothing helped and the problem still persists. and also, in my opinion, increasing the timeout configuration is not a solution. Don't get to the core of the problem which is slow performance.
Hi.
I have an update about my test with the above traffic rate and below configuration.
Any suggestion/advice would help. thanks.
@slim-bean
my resources:
Querier:
    Memory:  6Gi
    CPU:
          Request: 3
          Limit:    6
    Min Replica:    3
Ingester:
      Memory: 7Gi
      CPU:
            Request: 500m
            Limit:     1
      Min Replica:    2
Query FrontEnd:
        Memory: 1Gi
        CPU:
              Request: 1
              Limit: 2
        Min Replica: 2
Query Scheduler:
        Memory: 1Gi
         CPU:
                Request: 1
                Limit: 2
        Min Replica: 2
and my configuration
      max_recv/send_msg_size:     536870912000
      http_server_read/write/idle_timeout:     600
      proxy_read/send_timeout     300;
      proxy_connect_timeout     300;
      client_max_body_size     100M;
      Querier timeout:  10m
      max_query_parallelism:     32
      split_queries_by_interval:     15m
      Max_concurrent:     512
      Cache enabled
      Querier replica set to 3 with hpa
and result [3-6 hour]:

and also I increase the replica of the querier pod to 32 but nothing changed appreciate it if you could help me figure this out. how can I increase performance or at least get rid of 504 errors
The 504 error is coming from nginx, increasing timeouts in nginx should remove the 504 proxy_read_timeout iirc is the timeout to change
I just typed out a longer response but I'm on my phone and bumped a link and lost it 😬
The short version is that we are able to get query throughput out of Loki at rates of 50-100GB/s, we've had good success making Loki queries fast. Although there are many reasons from config to resources to storage that affect performance.
But not all storage is created equal... We use GCS on Google and S3 on Amazon which both work very well for highly parallelized workloads.
One of the examples in this thread is using a filesystem store which won't parallize at all, and I saw a mention of ceph which can be fast but we've also seen it slow, depends on how well it's built.
I'll try to follow up next week with some benchmark examples using the minio warp tool
The short version is that we are able to get query throughput out of Loki at rates of 50-100GB/s, we've had good success making Loki queries fast. Although there are many reasons from config to resources to storage that affect performance.
I've been testing loki for a fair amount of time without great success. I cannot go above 1GB/s despite scaling the cluster vertically and horizontally. I've also poked around in the configuration to see what are the impact on the performance. I've also tried with and without memcached or redis which end in all ingesters going OOM. My current conclusion is that tuning loki is not straighforward and I'm a bit lost. I understand it can be hard as you pointed not all storage are equals. On my end i'm using a S3 compatible, the same one I'm using with mimir. My mimir clusters are working like a charm.
@slim-bean would you be able to recommend a production ready configuration with sensible setting to get performance on read path and capacity planning, something similar to mimir?
I meet the same issue.
I have 1Tb log per day, about 800 0000 count/ per min.
My cluster info: ec2 : 16c + 64Gb * 3 storage: aws s3
ingest: 3 queirer: 3 query-front: 3 query schedule: 3 gateway: 3
when I query about 3 hour log , my ingest get oom . I don't know how hug mem should I need . May someone share your cluster info and configuration. Thanks.