devtools
 devtools copied to clipboard
Performance tools for Flutter
In this screenshot, the mouse is at the far right side of the selected flame chart node. The tooltip should be centered there instead of in the center of the...
This page should provide a high-level summary of Live FPS, CPU, Memory, and network activity on a common timeline, helping a user understand which parts of their application activity are...
Seems like a regression that this assert is firing once again. Commented out for now, but this needs to be investigated. assert in `cpu_profile_transformer.dart`: ``` assert(cpuProfileData.profileMetaData.sampleCount == cpuProfileData.cpuProfileRoot.inclusiveSampleCount); ```

i wanted to use memory trace tool in devtools and stumbled upon these issues 1. ***(see video)*** chart sometimes does not correspond with memory values. on the video see on...
allow to change chart scale of the graph on the memory usage section this is how it currently looks like 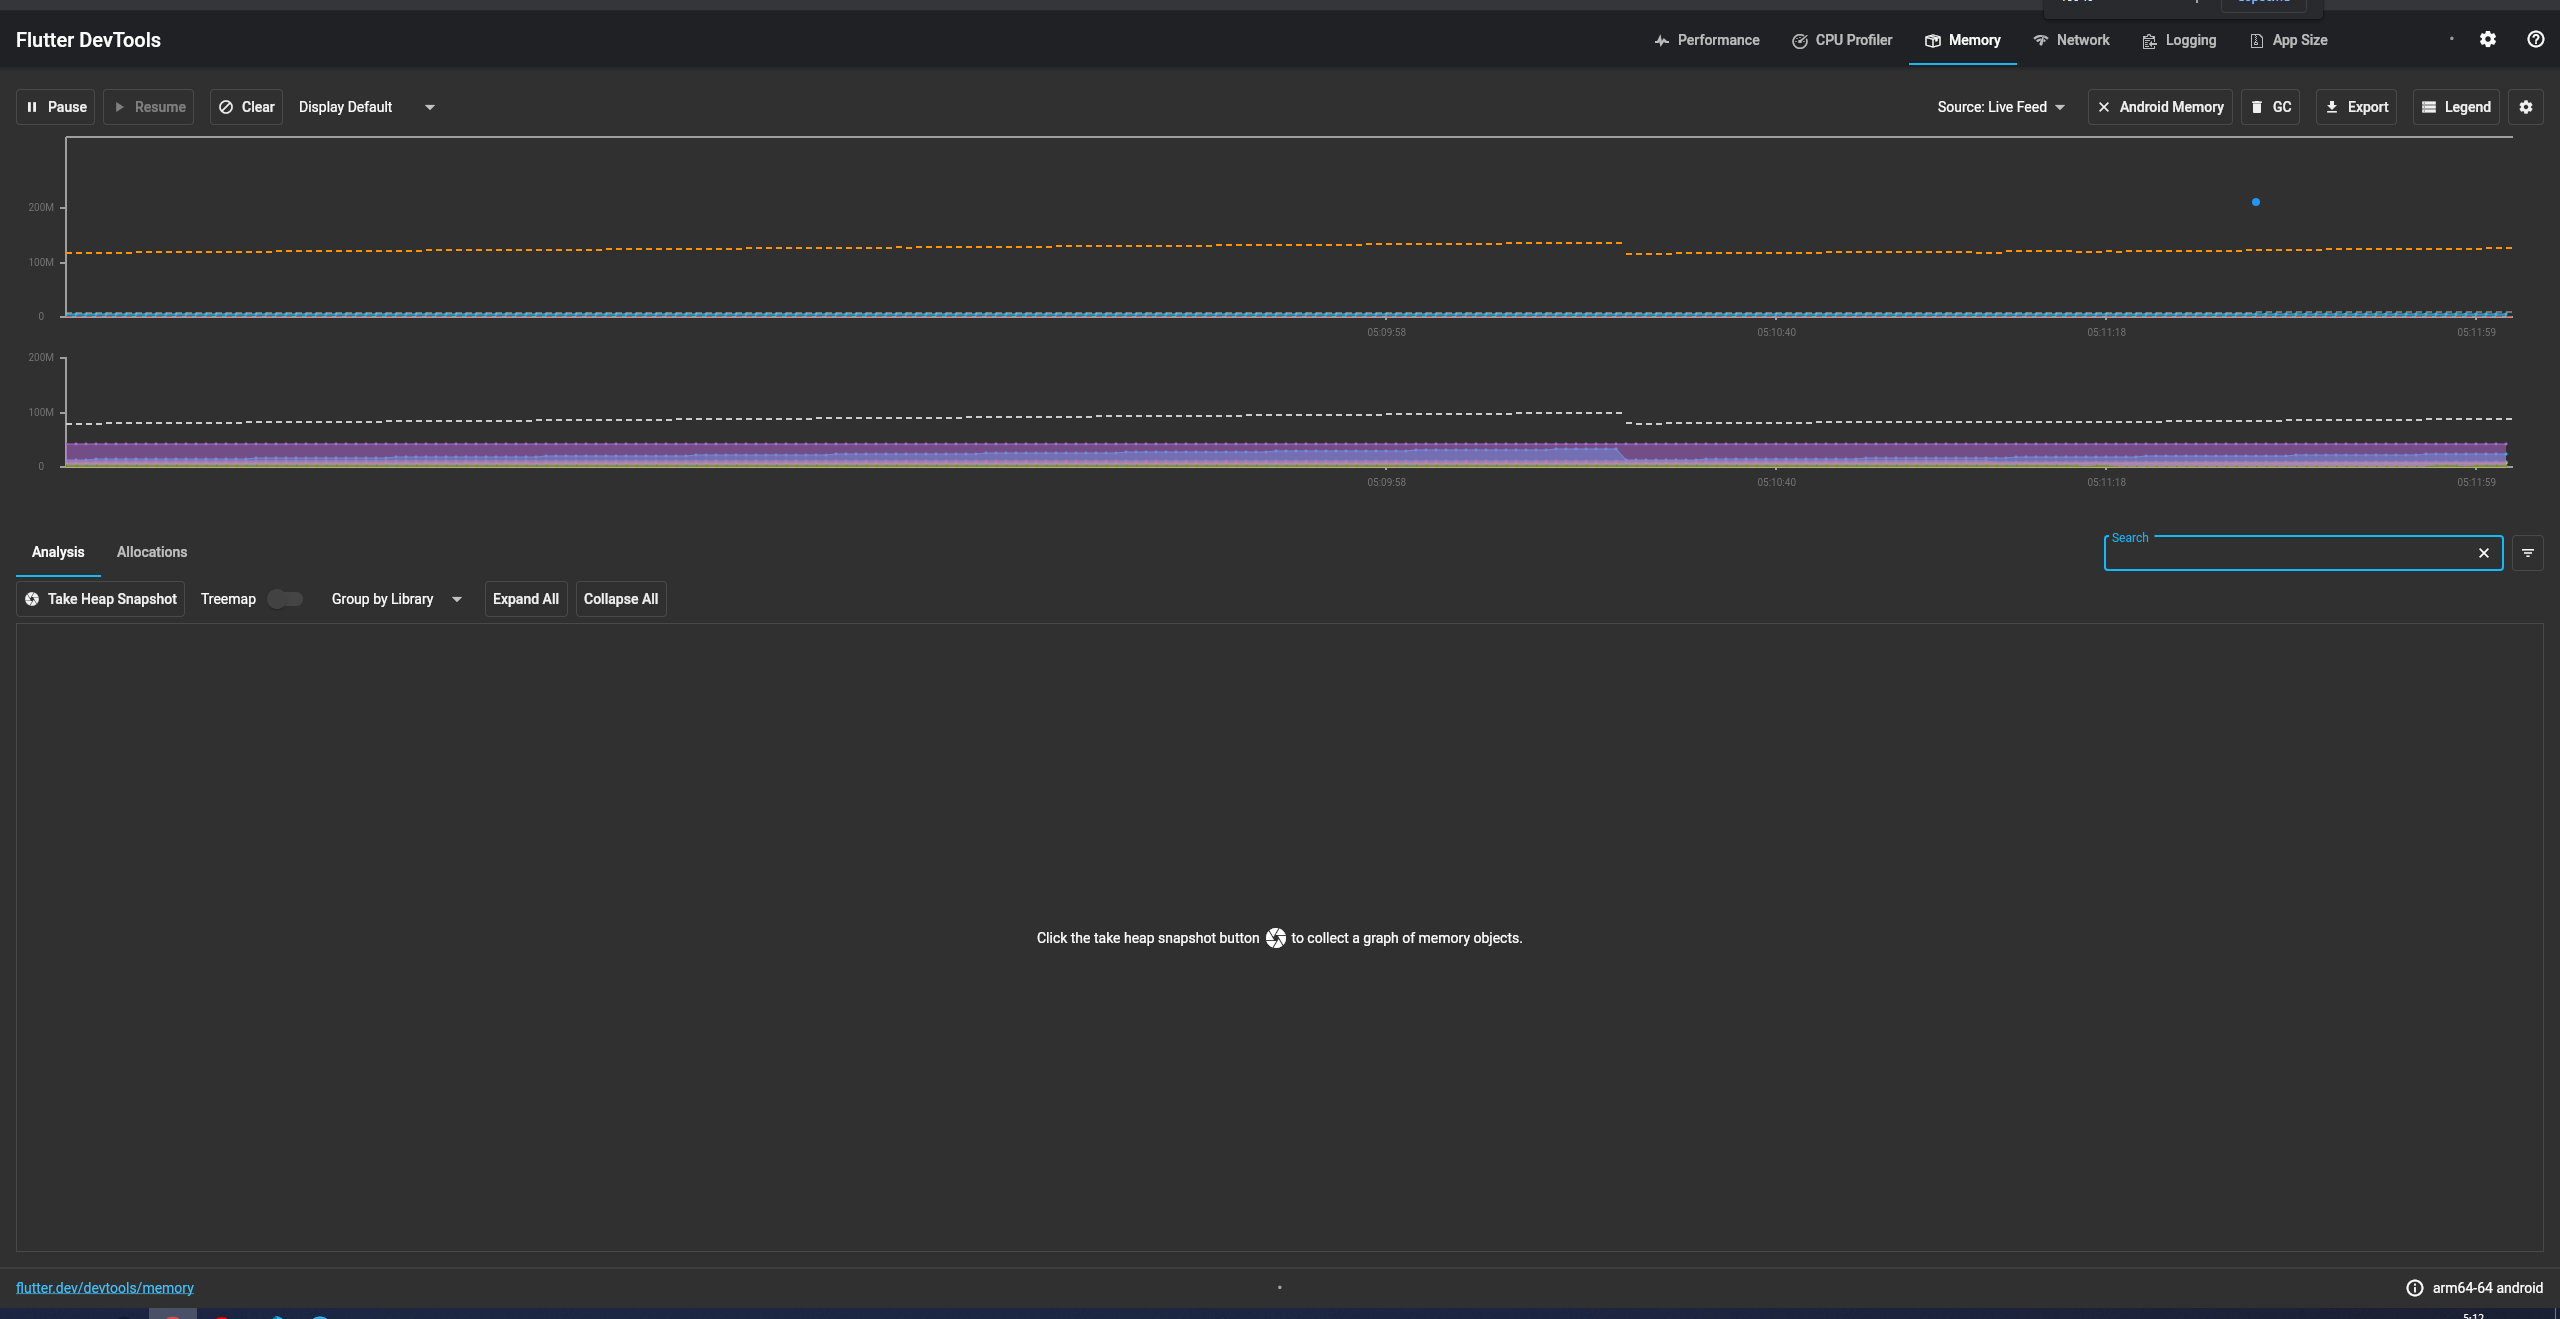 from such graph it's really hard to see the...
On the launch page (`devtools_app/lib/src/flutter/connect_screen.dart`), there should be some validation on the input URL, if I for instance enter `random text inserted into connect box` in the `Connect` box where...
For example, frequently main axis can't be set to a value other than center if textDirection is null as is often the case.
Based on UI perf diary homework study, participants noted there were several things they would like to improve on the UI performance documentation - Many used DevTools docs and performance...
This will help diagnose why users had certain failures such as no profile samples that may be due to having the wrong vm flags set. Fyi @kenzieschmoll
It took me a while to figure out what url I needed to type into the input box. I finally found that it was printed in the console when I...