profiler
 profiler copied to clipboard
Firefox Profiler — Web app for Firefox performance analysis

Before: 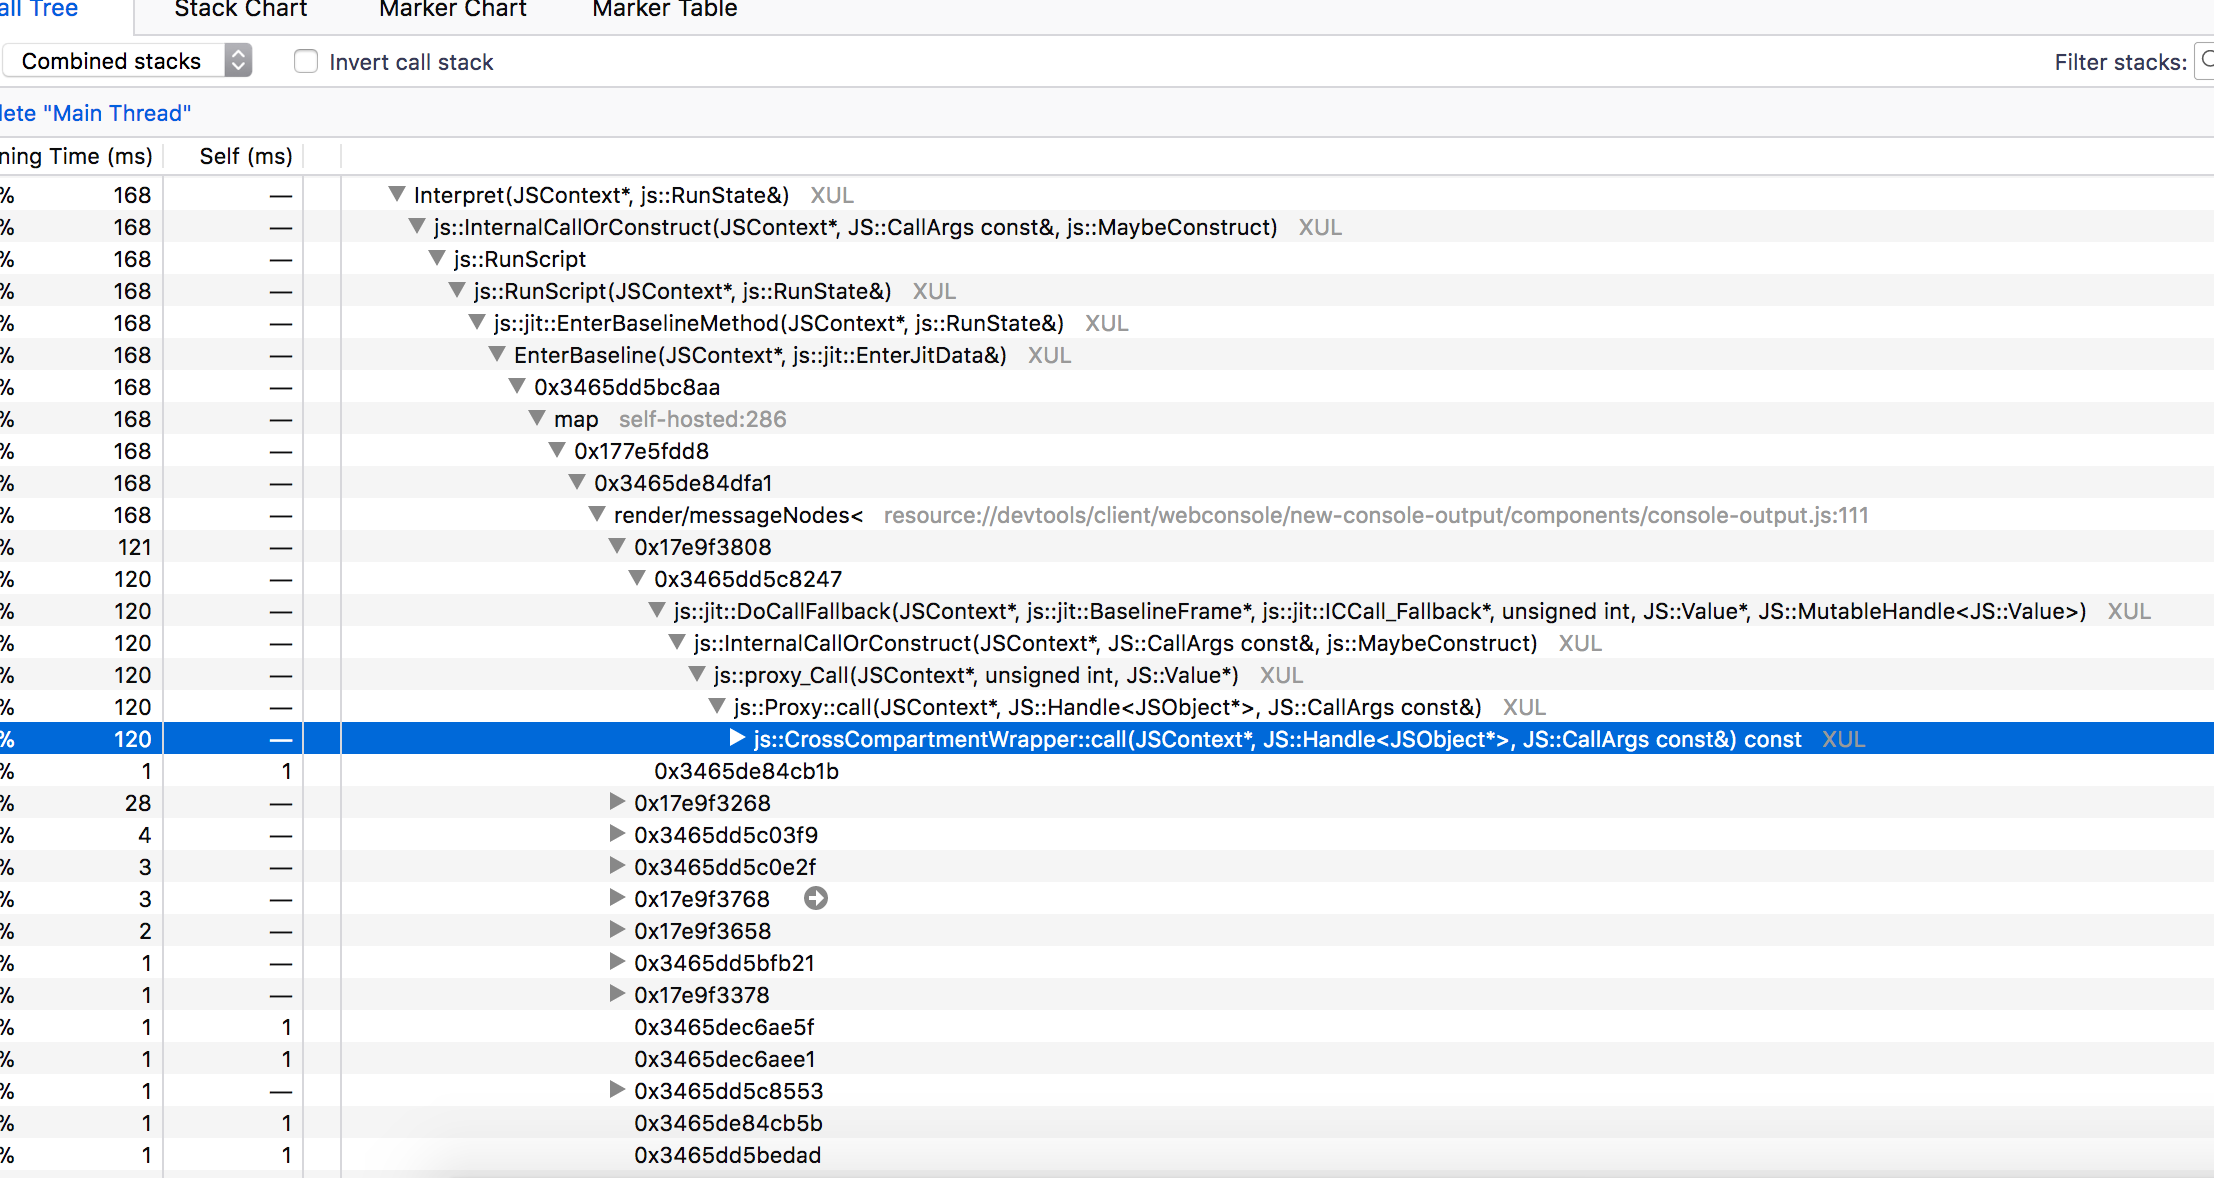 After filtering to JS only (aka nothingness): 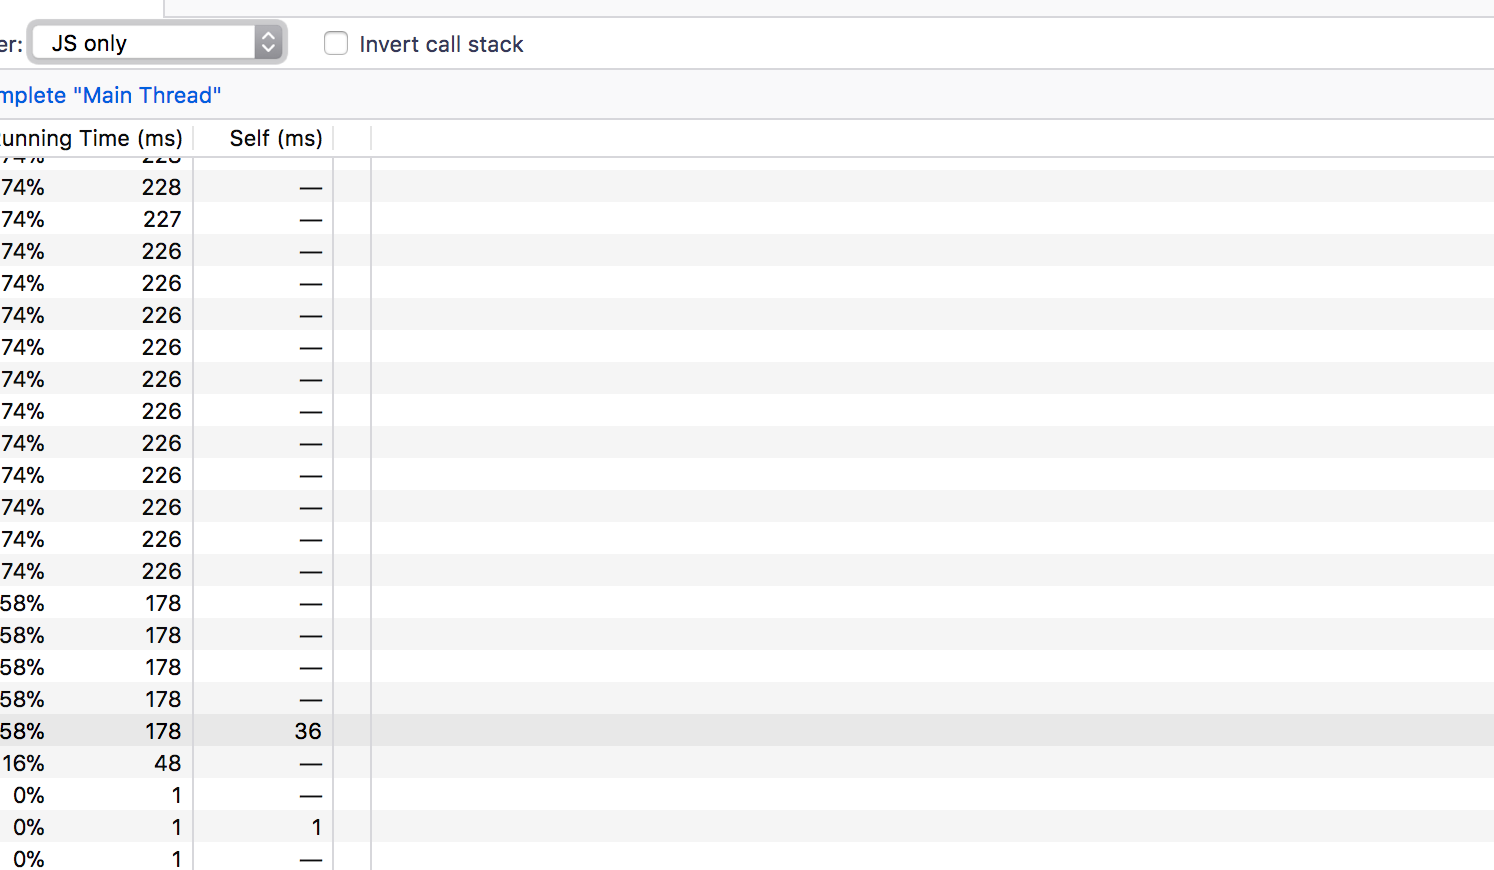 The list should scroll the correct node into view. ┆Issue is synchronized with this [Jira Task](https://mozilla-hub.atlassian.net/browse/FP-686)
This is useful for users on slow machine. 2 possibilities: * directly share through the add-on, opening a simple page, so that the slow machine doesn't have to load the...
I believe the fix here is to unhook the Viewport from dispatching actions. We should attach an event emitter to the store that operates independently of the actions. The mouse...
Currently, in MarkerTooltipContents.js, only specific markers are supported, it means when people trying to add some new markers with some payload, they would need to also add corresponding code to...
We should host the examples or expose them better. I also have a few from presentations I need to merge in. ┆Issue is synchronized with this [Jira Task](https://mozilla-hub.atlassian.net/browse/FP-682)
When I'm profiling, it's pretty common for me to want to see both C++ and JS, but to filter out all the XPConnect and SpiderMonkey stuff, so I can just...
e.g. use real title like h1, h2. ┆Issue is synchronized with this [Jira Task](https://mozilla-hub.atlassian.net/browse/FP-680)
This should be broken out into separate issues on each tab with an agreed upon set of keys to use. ┆Issue is synchronized with this [Jira Task](https://mozilla-hub.atlassian.net/browse/FP-679)
Currently this threshold is hardcoded in https://github.com/devtools-html/perf.html/blob/c8801086a711b0fff7e0d87bb88b8ebfa57c620d/src/reducers/profile-view.js#L607. We should provide an UI to change this, as different users have different requirements. 50ms is good for events like click, but not...
Asked by nical This property would hold an array of timestamps / values (or an array of these graphs if we want to support drawing several of them) that we...
Metadata
Owner
Metadata
Firefox Profiler — Web app for Firefox performance analysis