profiler
 profiler copied to clipboard
Firefox Profiler — Web app for Firefox performance analysis

With the profile: https://profiler.firefox.com/public/cxm9jnj9d40j4j7f0dyzhfs7bhh7wh69kxcxdcr/calltree/?implementation=js&resources&thread=Aj&v=7&view=active-tab You can see some small white bumps on top of the yellow ones:  When I'm hovering them with the mouse, the profiler is crashing with...
Support to show local tracks that are specific to a marker. The behavior (and the different lines in the track) can be configured via a `trackConfig` field the MarkerSchema of...
This resolves #3761 For profiles with large amounts of merges: * This makes the UI more reasonable by grouping the merges. * The full profile load no longer kills the...
I've a Microsoft surface and want to reduce the profile to a given range (start and end point). By touching I can set the marker appropriately but it's not possible...
We have a check while shortening that converts back all non profiler.firefox.com urls: https://github.com/firefox-devtools/profiler/blob/6b0146209d963aaa1154a9777b71a9125f5b822b/src/utils/shorten-url.js#L13-L19 I think this is useful when we are working on `localhost`, but I don't think this...
Handles `touchstart` events like `mouseclick` events and `touchmove` like `mousemove` events thereby enabling the selection using touch events only. It does not support multi-touch and just takes the first touch....
The space available for additional information (environment variables, program configurations, flags, ...) is quite limited in the "Profile info" container: 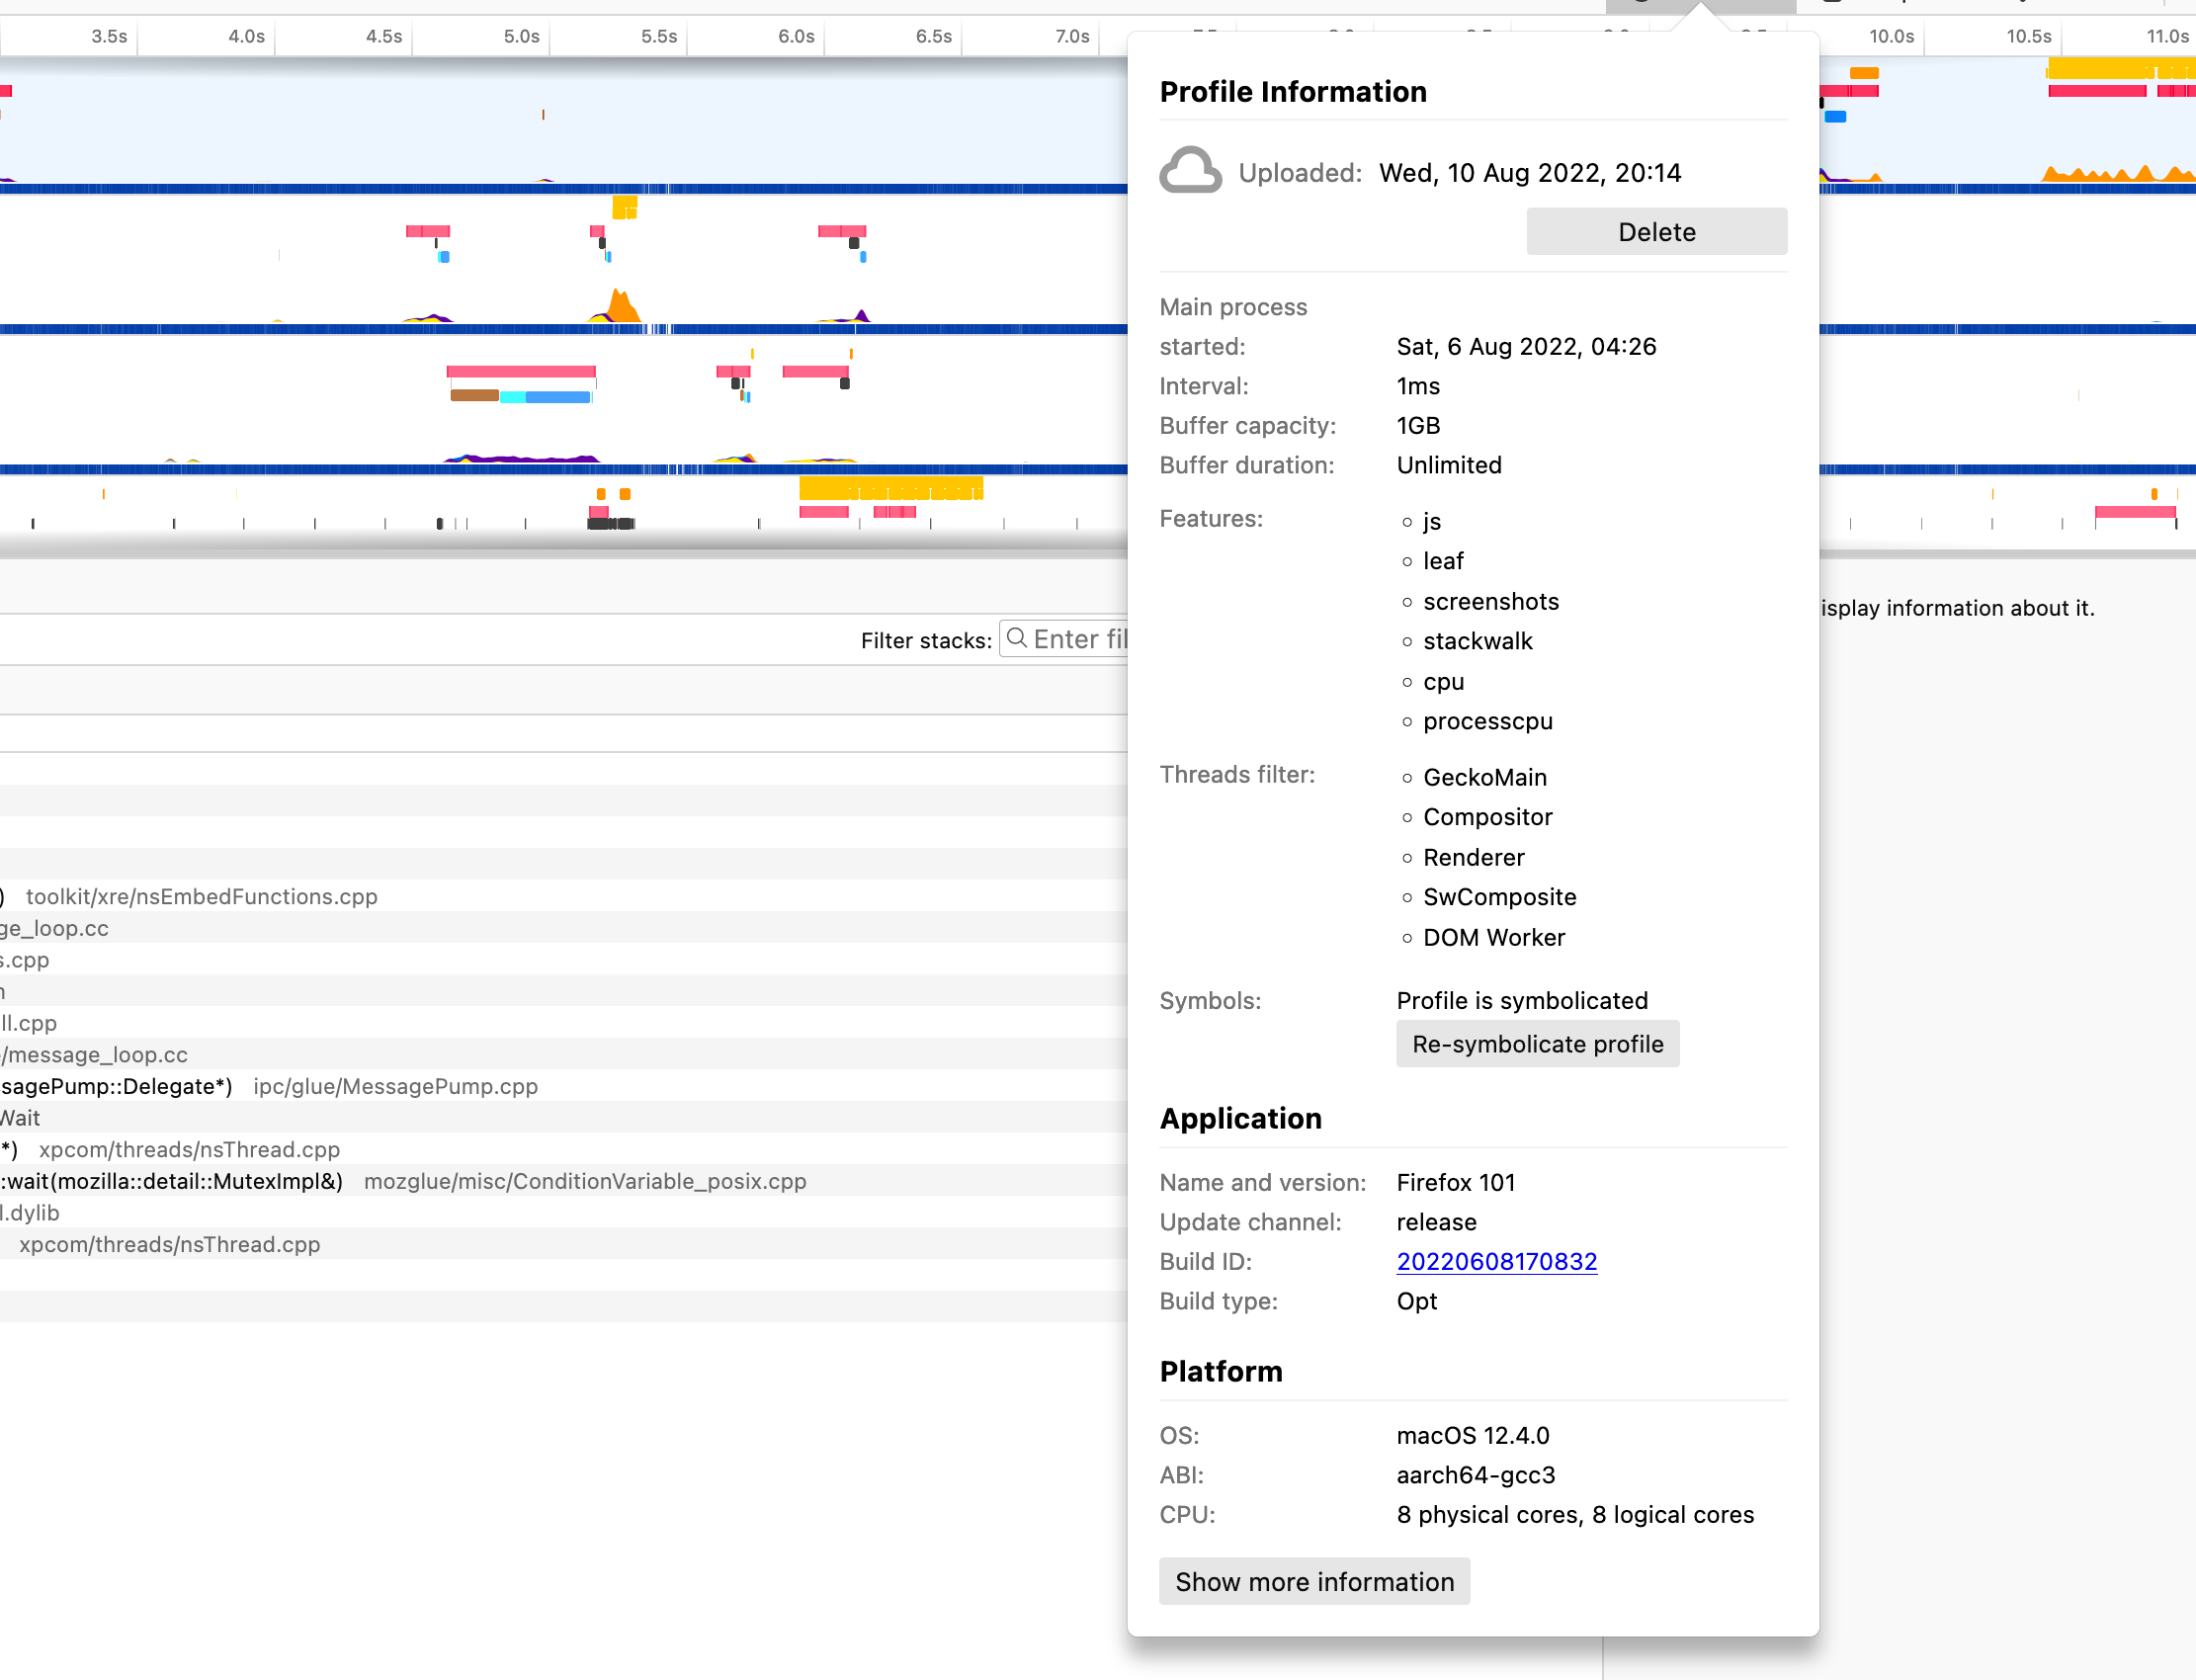 I would therefore like to implement a "Show more...
This sounds like a ridiculous issue to file, but I'm completely stumped. I've spent the last 10 minutes trying to figure it out. Things I've tried. * Scrolling * Ctrl+Scroll...
We already have a nice Call Tree view, the only thing missing is a table that presents all methods with their total and self times: 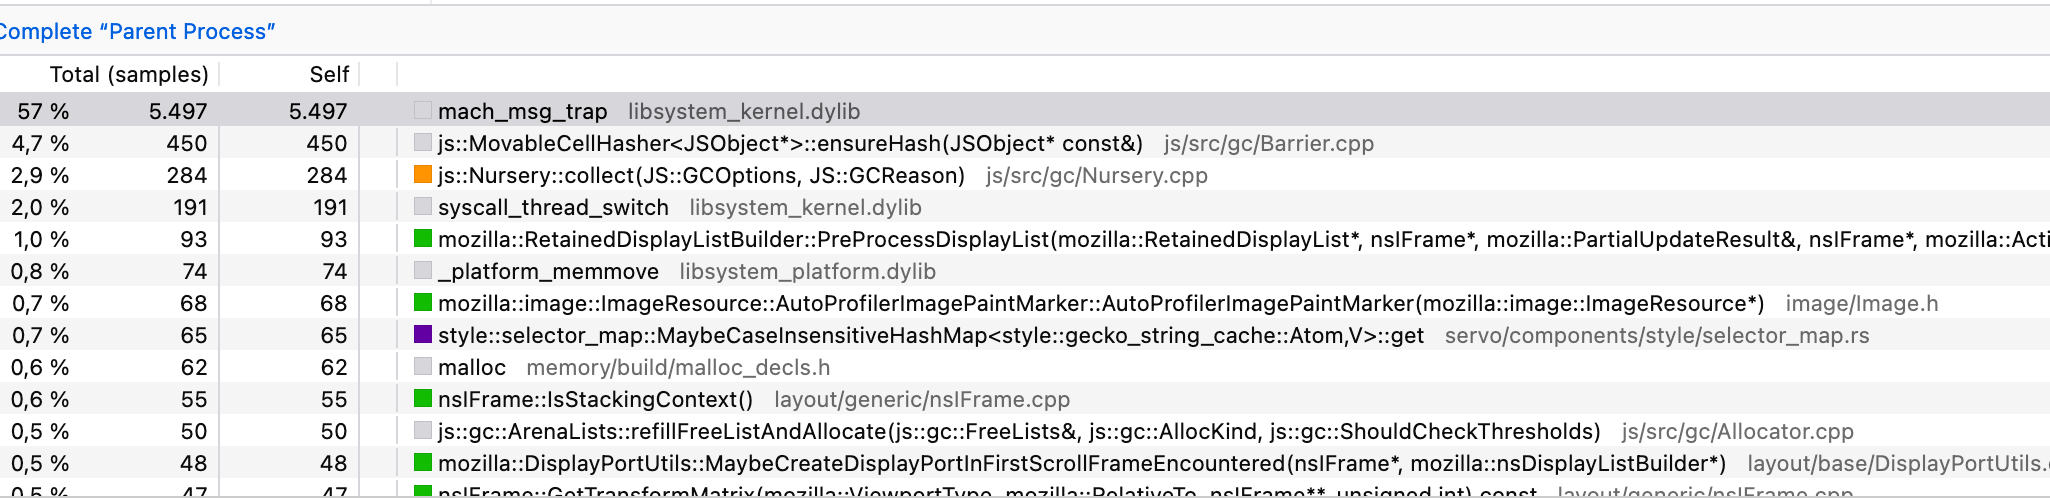 This one of the...
In #4214 when upgrading jest to v29, we changed the snapshot format to the old default. It would be good to use the new default when we don't have too...
Metadata
Owner
Metadata
Firefox Profiler — Web app for Firefox performance analysis