profiler
 profiler copied to clipboard
Support to show local tracks using marker data
Support to show local tracks that are specific to a marker. The behavior (and the different lines in the track) can be configured via a trackConfig field the MarkerSchema of every markers. This allows the simple creation of addition tracks without altering the profiler UI itself. This is especially important for imported profiles.
An example can be seen in the following (which constitutes a real use case in my application):
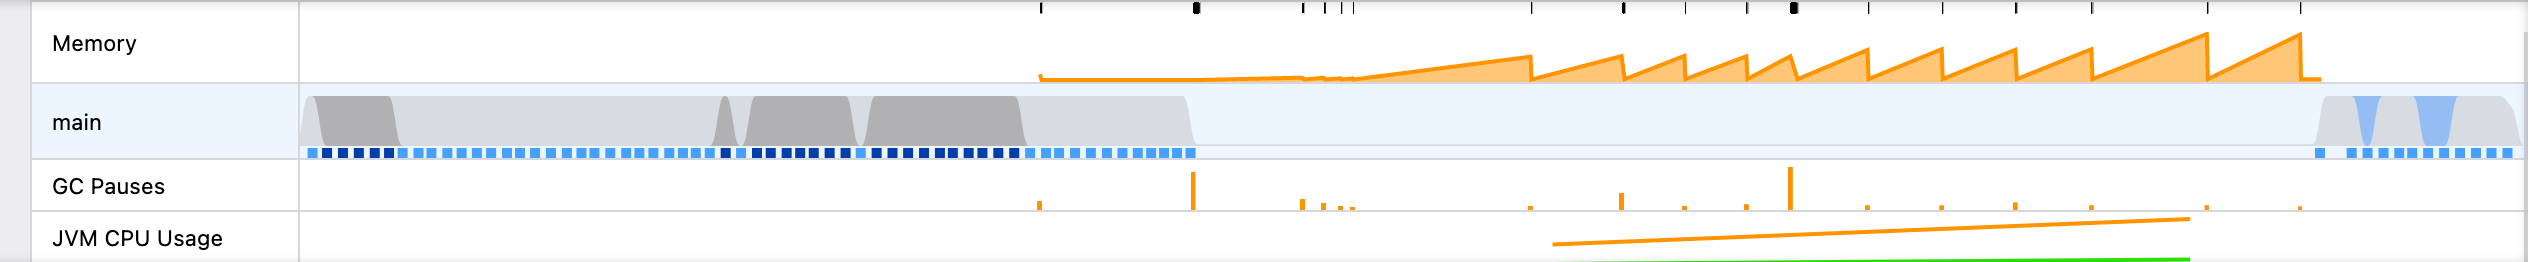
The "GC Pauses" tracks is based on the "jdk.GarbageCollection" marker payload and configured as follows:
"trackConfig": {
    "label": "GC Pauses",   // label of the track
    "lines": [
        {
            "key": "longestPause",  // key in the payload to use
            "type": "bar"       // bar charts and line charts are supported
        }
    ],
    "isPreSelected": true // select this local track by default
}
The "JVM CPU Usage" track is configured in a similar fashion:
"trackConfig": {
    "label": "JVM CPU Usage",
    "lines": [   // multiple lines are supported
        {
            "key": "jvmUser",
            "type": "line"
        },
        {
            "key": "jvmSystem",
            "strokeColor": "green", // the default color is orange
            "type": "line"
        }
    ],
    "isPreSelected": true
}
Codecov Report
Base: 88.56% // Head: 88.52% // Decreases project coverage by -0.03% :warning:
Coverage data is based on head (
10fe261) compared to base (64cdd7e). Patch coverage: 86.41% of modified lines in pull request are covered.
Additional details and impacted files
@@            Coverage Diff             @@
##             main    #4198      +/-   ##
==========================================
- Coverage   88.56%   88.52%   -0.04%
==========================================
  Files         282      284       +2
  Lines       25333    25670     +337
  Branches     6817     6897      +80
==========================================
+ Hits        22435    22725     +290
- Misses       2696     2741      +45
- Partials      202      204       +2
| Impacted Files | Coverage Δ | |
|---|---|---|
| src/actions/profile-view.js | 89.62% <0.00%> (-0.15%) |
:arrow_down: |
| src/components/timeline/LocalTrack.js | 67.77% <0.00%> (-2.34%) |
:arrow_down: |
| src/selectors/app.js | 54.37% <0.00%> (-1.04%) |
:arrow_down: |
| src/profile-logic/tracks.js | 81.62% <72.28%> (-1.49%) |
:arrow_down: |
| src/components/timeline/TrackCustomMarkerGraph.js | 91.75% <91.75%> (ø) |
|
| src/selectors/per-thread/markers.js | 94.07% <95.45%> (+0.44%) |
:arrow_up: |
| src/app-logic/constants.js | 100.00% <100.00%> (ø) |
|
| src/components/timeline/TrackCustomMarker.js | 100.00% <100.00%> (ø) |
|
| src/components/tooltip/Marker.js | 98.44% <100.00%> (ø) |
|
| src/profile-logic/marker-schema.js | 89.28% <100.00%> (+0.09%) |
:arrow_up: |
| ... and 2 more |
Help us with your feedback. Take ten seconds to tell us how you rate us. Have a feature suggestion? Share it here.
:umbrella: View full report at Codecov.
:loudspeaker: Do you have feedback about the report comment? Let us know in this issue.
I still have to write some tests for it, but it's functionally complete (for now).
This PR especially helps with imported profiles, it allows me to show different CPU usage information which is not possible with the current implementation.