echarts
 echarts copied to clipboard
Apache ECharts is a powerful, interactive charting and data visualization library for browser

### What problem does this feature solve? We want to render financial information from different years with the amounts on the yAxis and and the month of the year on...
### Version 4.5.0 ### Link to Minimal Reproduction _No response_ ### Steps to Reproduce [Bug] x轴显示固定的12个月份,折线的数据量到天,然后是某三年的对比折线图,我把x轴固定显示12个月份后,折线出不来 ### Current Behavior [Bug] x轴显示固定的12个月份,折线的数据量到天,然后是某三年的对比折线图,我把x轴固定显示12个月份后,折线出不来 ### Expected Behavior [Bug] x轴显示固定的12个月份,折线的数据量到天,然后是某三年的对比折线图,我把x轴固定显示12个月份后,折线出不来 ### Environment ```markdown -...
### What problem does this feature solve? Now if I set the data of markarea smaller than line data, users won't see the area. Because the min of x axis...
### Version 5.22 ### Link to Minimal Reproduction _No response_ ### Steps to Reproduce 我通过on('click', params => { xxxxxx }); 进行charts的监听,如果在PC端是可以的每次点击事件都能成功都能返回params; 但是移动端,多点几次才能成功,才会返回params; ### Current Behavior 我通过on('click', params => { xxxxxx...
### What problem does this feature solve? how to set series.graph. symbol backgroundColor and autosize to fit the label text 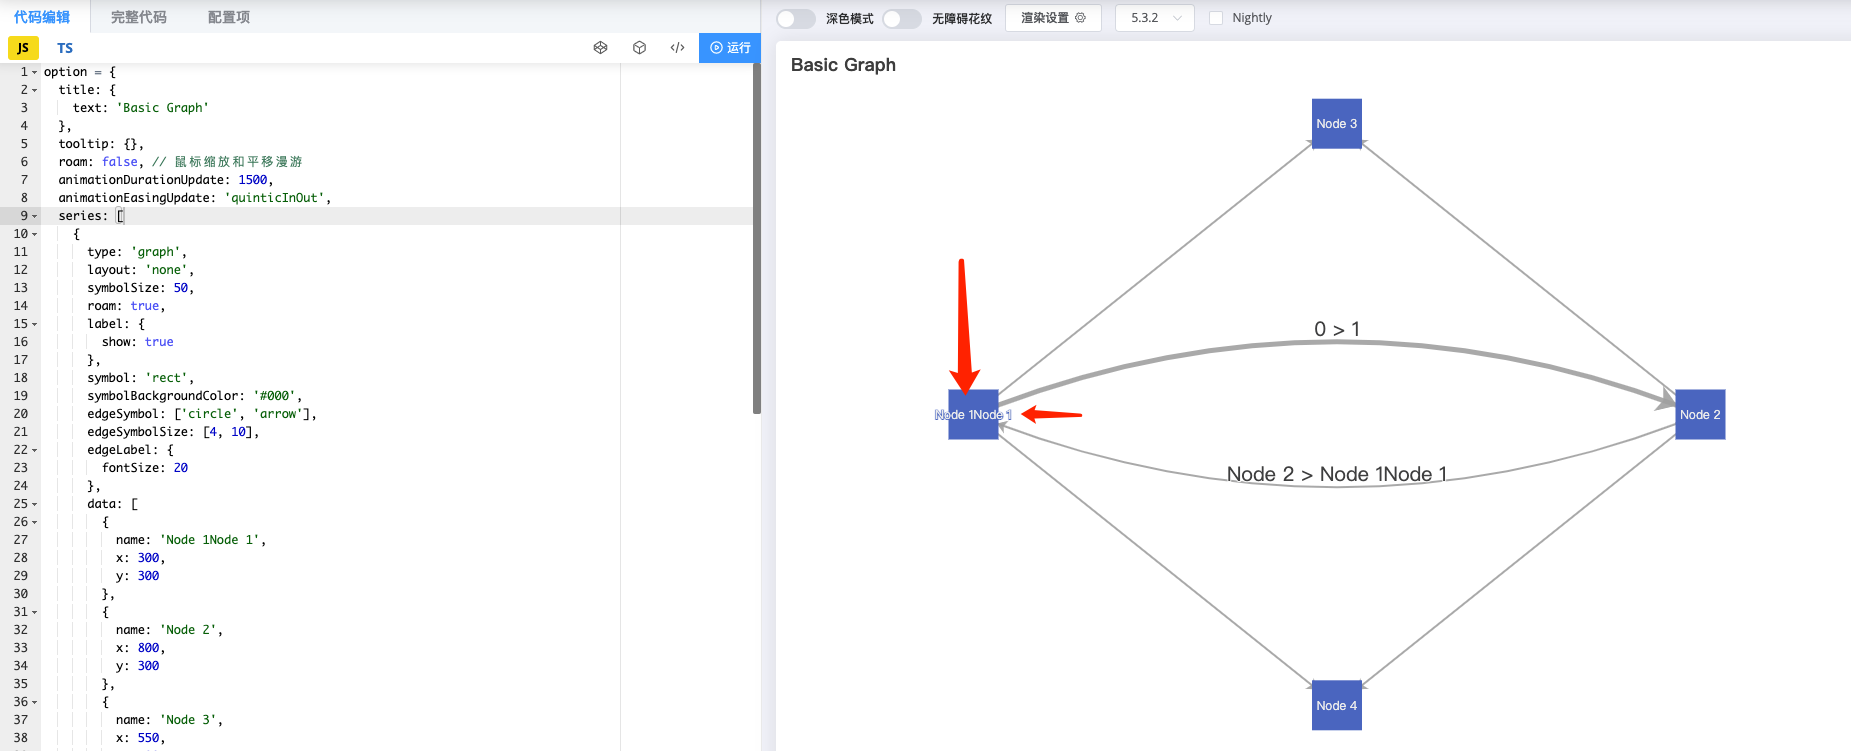 symbol ### What does the proposed API look like?...
### Version e.g.5.3.2 ### Link to Minimal Reproduction _No response_ ### Steps to Reproduce step1: Use the timer to execute the drawing function after the document is loaded. The result...
### Version 5.1.2 ### Link to Minimal Reproduction _No response_ ### Steps to Reproduce ```js visualMap: { show: false, dimension: 1, pieces: [ { gte: 0, lte: value, color: 'rgb(84,112,198)'...
### What problem does this feature solve?  When using grid to render multiple echarts, setting the background color of the grid does not include the coordinate axis, and the...
### What problem does this feature solve? 如何实现:Y轴设置两个刻度的长度,第一个高度写死,第二个高度根据内容自动变化,效果图如下: 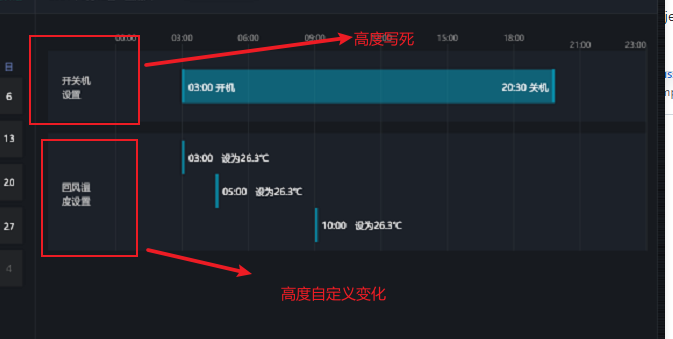 ### What does the proposed API look like? 帮忙解答,谢谢
### Version 5.5.0 (.min.js) ### Link to Minimal Reproduction https://keyonvandenelzen.github.io/echarts-tooltip-csp-violation/ ### Steps to Reproduce 1. Set CSP directive 'style-src' to 'self' 2. Create a bar, line or pie chart (I...