[Bug] 视觉映射组件两个区间的值相同时,折线图点不连成线
Version
5.1.2
Link to Minimal Reproduction
No response
Steps to Reproduce
visualMap: {
    show: false,
    dimension: 1,
    pieces: [
      { gte: 0, lte: value, color: 'rgb(84,112,198)' },
      { gt: value, color: 'red' },
    ]
  },
const value = 0
视觉映射组件中两个区间的值重复了,折线图点就不连成线了,因为value动态的,且整个图最小值为0
Current Behavior
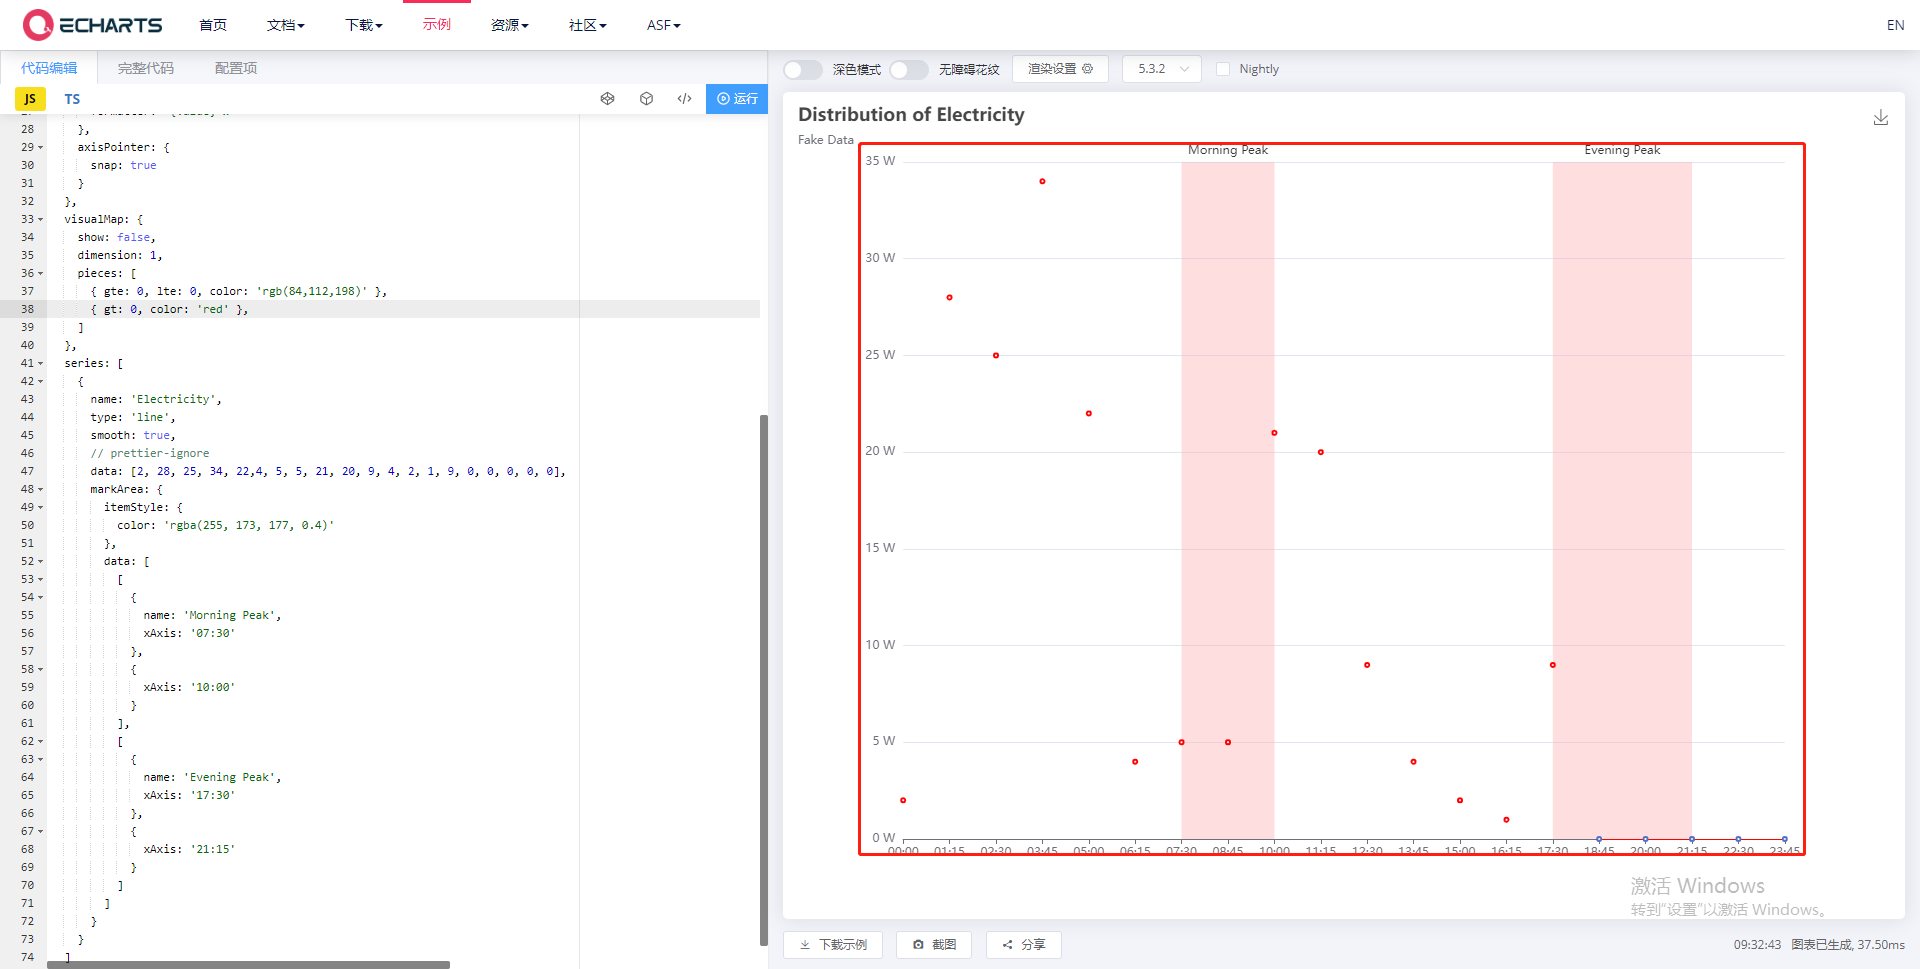 现在是不连成线的
Expected Behavior
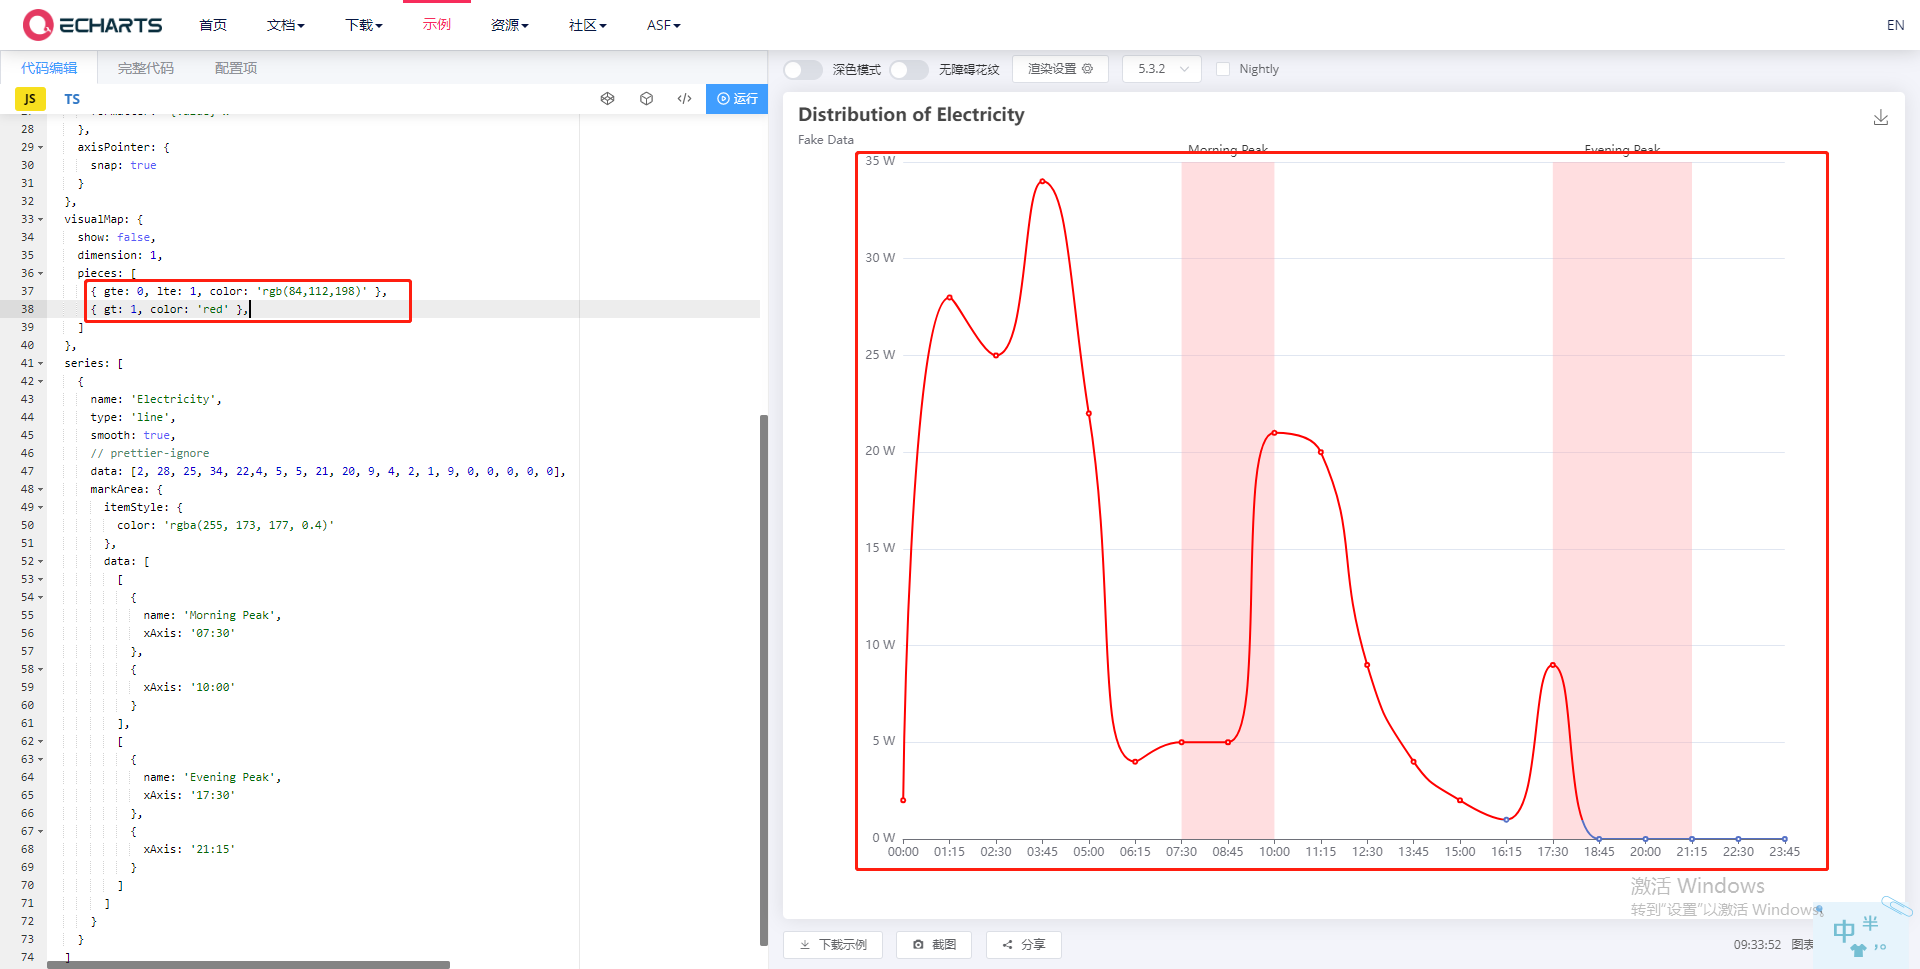 期望能正常连成线
Environment
- OS:
- Browser:Chorme 101.0.4951.67
- Framework:
Any additional comments?
No response
@zx-zx22 It seems you are not using English, I've helped translate the content automatically. To make your issue understood by more people and get helped, we'd like to suggest using English next time. 🤗
TRANSLATED
TITLE
[Bug] When the values of the two intervals of the visual mapping component are the same, the line chart points are not concatenated into lines
BODY
Version
5.1.2
Link to Minimal Reproduction
No response
Steps to Reproduce
visualMap: { show: false, dimension: 1, pieces: [ { gte: 0, lte: value, color: 'rgb(84,112,198)' }, { gt: value, color: 'red' }, ] },
const value = 0
The values of the two intervals in the visual mapping component are repeated, and the points of the line graph are not connected into a line, because the value is dynamic, and the minimum value of the entire graph is 0
Current Behavior
It's disconnected now
Expected Behavior
Hope to connect normally
Environment
- OS:
- Browser: Chorme 101.0.4951.67
- Framework:
Any additional comments?
No response
This issue has been automatically marked as stale because it did not have recent activity. It will be closed in 7 days if no further activity occurs. If you wish not to mark it as stale, please leave a comment in this issue.
This issue has been automatically closed because it did not have recent activity. If this remains to be a problem with the latest version of Apache ECharts, please open a new issue and link this to it. Thanks!