echarts
 echarts copied to clipboard
Apache ECharts is a powerful, interactive charting and data visualization library for browser

### What problem does this feature solve? 在画箱线图boxplot时,指定y轴范围后,箱体超出图表上下限 ### What does the proposed API look like? 想请教一下有无解决的方法
### Version 5..5.0 ### Link to Minimal Reproduction https://echarts.apache.org/examples/en/editor.html?c=bar-waterfall ### Steps to Reproduce I want the width/height of the column or bar chart for each data bar based on that...
### Version 5.4.2 ### Link to Minimal Reproduction https://github.com/yay/echarts-tooltip-type-bug ### Steps to Reproduce Uncomment the following piece of code in `main.ts` in the linked GitHub repo to see the TypeScript...
### Version 5.4 ### Link to Minimal Reproduction https://codepen.io/isachenx/pen/BaEooWx ### Steps to Reproduce I forked the "Distribution of Electricity" example. Instead of using series.data for x and y axis separately,...
### What problem does this feature solve? Currently there is the option for a "stacked" Area chart What I am looking for is slightly different. Currently, using the stacked area...
### What problem does this feature solve? 给chart绑定了datazoom事件,获取到新的起止时间后,会去后端发请求,请求到新的图表数据后会更新chart数据;会生成一个新的chart,这个时候新chart的zoom reset没有被选中,没有办法rest数据怎么办? ` const onDataZoom = (e: any) => { if (e) { if (e.batch.length !== 0) { if (Object.keys(e.batch[0]).indexOf('startValue') !== -1) {...
### What problem does this feature solve? import * as echarts from 'echarts' chart = proxy.$echarts.init(document.getElementById('myEcharts'), 2: treemap 3: chart.setOption->label->formatter:params Can't get the height and width of the rectangle when...
### What problem does this feature solve? Line graphs using the time type will be connected into lines, and data with long time intervals will appear as a long line...
### What problem does this feature solve? As an apple user, I use double-finger horizontal swipe for horizontal scroll. It is native behavior. As well as SHIFT + WHEEL for...
### Version 5.4.1 ### Link to Minimal Reproduction https://echarts.apache.org/examples/zh/editor.html?c=line3d-orthographic&gl=1 ### Steps to Reproduce 1.vite创建vue+ts项目 2.npm安装"echarts": "^5.4.1","echarts-gl": "^2.0.9" 3.引入你们的3D折线图示例代码 ### Current Behavior  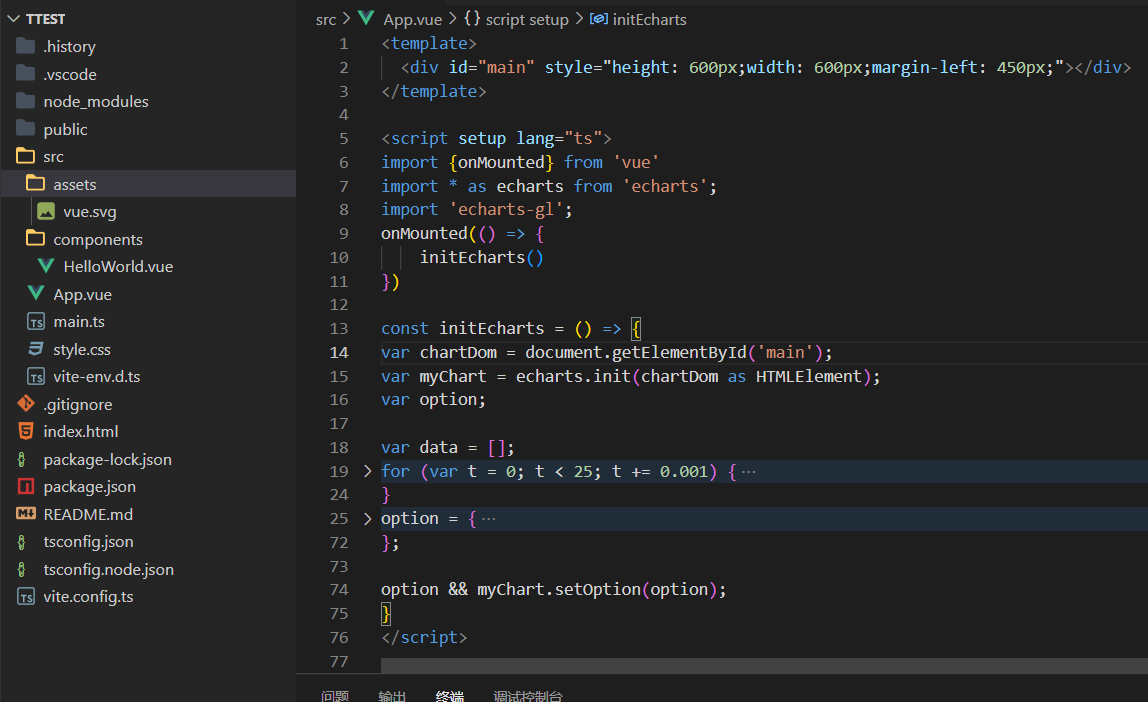 折叠部分的代码与你们示例的代码一致,结果出现警告geo3D exists ### Expected Behavior 不要出现警告 ###...