echarts
 echarts copied to clipboard
Apache ECharts is a powerful, interactive charting and data visualization library for browser

### What problem does this feature solve? The current sampling algorithms work well when graphing a few charts, but the performance still suffers when graphing more and more plots on...
### What problem does this feature solve? My use case is a line series with steps, i.e. it only consists of vertical and horizontal segments. Our users would like to...
Follow-up of https://github.com/apache/echarts/pull/16825 and https://github.com/apache/echarts/pull/12236 ## Brief Information This pull request is in the type of: - [x] bug fixing - [ ] new feature - [ ] others ###...
### Version 5.4.2 ### Link to Minimal Reproduction NA ### Steps to Reproduce Create several lines with different sampling distribution on the x axis The spacing doesn't seem right. ###...
### Version 5.4 ### Link to Minimal Reproduction https://codesandbox.io/s/bar-chart-drilldown-animation-forked-7b2t2w?file=/index.html ### Steps to Reproduce https://codesandbox.io/s/bar-chart-drilldown-animation-forked-7b2t2w?file=/index.html ### Current Behavior 目前不支持这种从左图到右图的变换 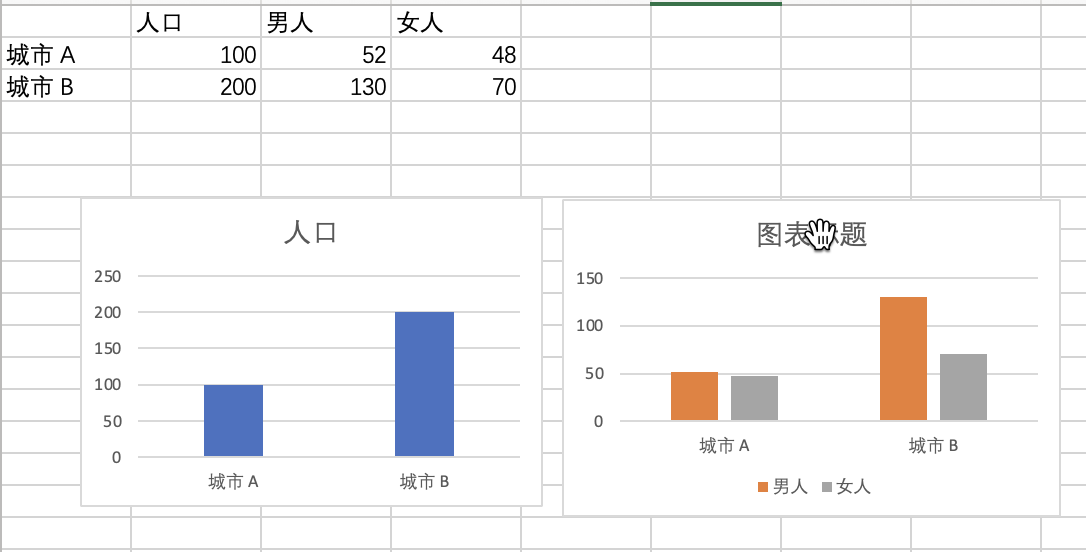 ### Expected Behavior 期望能支持变换 ### Environment ```markdown - OS: - Browser:...
### What problem does this feature solve? 当我使用双y轴的时候,主y轴有负值,次y轴没有负值,这样导致0刻度不对齐,容易误导看数,  ### What does the proposed API look like? y轴支持配置0刻度对齐,次y轴的0刻度和主y轴的0刻度对齐
### What problem does this feature solve? graphic组件如何超出坐标系范围不会自动隐藏。 这是一个示例: https://echarts.apache.org/examples/zh/editor.html?c=line-draggable&edit=1&reset=1&code=MYewdgzgLgBBCeBbARiANgZQJYC8CmMAvDAEwAMA3AFCiSwAmAhlI0TANpUwcAsZANDAC0ARjIBdflw5CAzAOEBWSdPZCA7ADYAdIsHkV3NZtm7BfQzJIltIwYolVx1EAAcoWcGwDe0j1DQ8AC4YX25uKDwADygQgHIAFQAneBgAESTGAHMsrDAsmCgACzwIAgAFEDyoCDipcJhAgDNYmDjgPDBIpLjpAF96wpB0D1cQsPCoJKwcvCSAeTB4sHA8OuluJpAkxGZukKaAVzBgDy8ACldGTMQIAEpQjfCkvChDpLAYc6eGuIANeIwADUP3CVxuEG0TBY7Ak2igIAAYlgonh6OcSA8QQ1fgAeZBJAB8AE1AdicdxwYxblDmIx2CJxPCkSi0Ri7qC7tQGn1-oMstN6OMngixm0ABwAUnWDVQUARiHiIhI0r50iiAEEolgIMKGog8iFRGQBE9dlEQupTQ0oPBXME2gA3RhoQ5rQbcRjaiAAGTyDu8MHAAC05iADi6yjBedwBtJ4FqdXrwgalsJ5B6YOaQpprZM7Q64s7Xe6nl6dX6wAGg2BQ0lwzAmpGCDHo4NoYxg8NFRwnhMbQX4hA0Fh6HMZTjNd6AJJgMcWmB5hpNLBoboAWRAY-Wq16PMz_fz9qHI7HPUz3ATM7n0RCS_CK7Xc0327aKyre_CcYah4ig7aeQQKOpYUlOOqzvOd4Xo2q4bluhbvmsTzfuEv6FP-cSAcBE4NFe4E3gu96bLBz7wTuH7IdIlhlNMpQhJwP6gqO8SMDhR6FiOH7QRAiDDMUIRTG63FIKgmC4A6CAoOg2D4NBHYhB2lHcOIVB9NQZRQAkWCIHgICHFA5xHCcZyfOcDwTAA9BZMAavQ9BwEUjD0CAADuMDAFgSTAIEEBfC5RRYMARQwDqMArLAjo6lgyCBA8CIwJ0jAxQQ9CZFk2jSIg8AAMKOUkUDaBp8zuJ4YDnIeAqMK4AXAApdLaLsriGccpylV8WCRIgggdhB0TmaCLxvB8jwUn-x5tB5XmBGxDSuCAQEmSEWW5dcBW0I6cyaSA5Ssmg5xxAKo51CFnV3NB3AQI541oQ0wCEed4TAPAUGgg0SQhJJokyQQ1kkK9bb_f9qXZFkSWBAJSRCf94DA1kBwtSZXz0FE3XwP1o3hOAlTVBkIN5Fk5w9QRgjsMUOraCjhQBZC8DiFy_0oRS4C8YcZS8Rt8PGW1ZkjRjDmuQkwxrlgTVE_O9MY4zOLM3pZR6a0RmtRc6N8wFY6CyMIuE3SvVRBLo1Sw0OAhGIRHhKgxz0Pj8SZC5M3RtyX4crG9MDIu9MuXkzkudoTn0AAohtXR-tAnRzPtLxAfgx2HK40J4JUC2lfTy15QV4D7R2XYgIgMdx8wCfzR1yfUIriOx_HifFxnKup6thWvMVJnlU8lXVYFdUsA1VXNVzFwdXgXUwGLfW829rzvJ8N0wHNSfgEtOVp9o62bYLO2ontB2CsdA-IM7OJqch-99K7VBl21l0C0Lozaywuu14v9dWxAVxQEFGpK2Vh62uNcSXy5WlXBsRolgUousXoNBHguKB_RT7ny8GrPAGthaix1gRB-K18pQh1K_d-n8W4Dl_ogwBn4T7UF5PAz4WMqhdFxjkfGt9GC60ELPFWHZ2BQPEGwOuWCV75URPWRA688Cb0OvQY6rDHZWRgAAVXzpEYedJMqPywUVEqGdDwgLor2Ck09mJtFYg9eSiiWCglbMpWB5CgA 可以将graphic拖到坐标系外:  起因是我在开发K线图的画线功能,发现超出坐标轴的线不会自动隐藏:  已经尝试过[bounding](https://echarts.apache.org/zh/graphic.elements.bounding),分别设置为"raw"或"all"都不行。 ### What does the proposed API look like? overflow-hide:true
### What problem does this feature solve? 在echarts 5.1.2版本中,我需要开发K线图表,图表中除了显示蜡烛图外,还需要显示均线,同时根据功能要求,要如同股票交易软件中蜡烛图页面显示的一样,在左上角固定位置显示MA5、MA10、M20,并根据用户鼠标滑动,更新显示当前MA均线N日的值,请问能否增加这样的功能?或者在5.1.2版本中,能否有类似的实现?  ### What does the proposed API look like? graphic.style.text 值可设为回调函数,由tooltip触发时联动触发,获取tooltip.formatter滑动时获取的当前节点的所有数据
### One-line summary [问题简述] 你好,我在写一个折线图,里面大概有20个左右的图例横置显示,现有的scroll功能我来回尝试,最多也只能显示一行,点翻页图标向左右滑动。 ### Version & Environment [版本及环境] + ECharts version [ECharts 版本]: v4.1.0.rc2 + Browser version [浏览器类型和版本]:chrome + OS Version [操作系统类型和版本]:windows 7 ### Expected behaviour [期望结果] 请问图例在可翻页时可不可以像非scroll时一样,一次显示两行或以上,然后仍然可以翻页。...
### Version 5.0.0 ### Link to Minimal Reproduction 无 ### Steps to Reproduce 用谷歌浏览器在官网示例使用也是同样的错误  ### Current Behavior 无 ### Expected Behavior 无 ### Environment ```markdown - OS: - Browser:...