BizCharts
 BizCharts copied to clipboard
Powerful data visualization library based on G2 and React.

BizCharts Version: version "4.1.11" Platform: 谷歌浏览器 这个是我希望的样子 折线图和柱状图 都是共享一个y轴 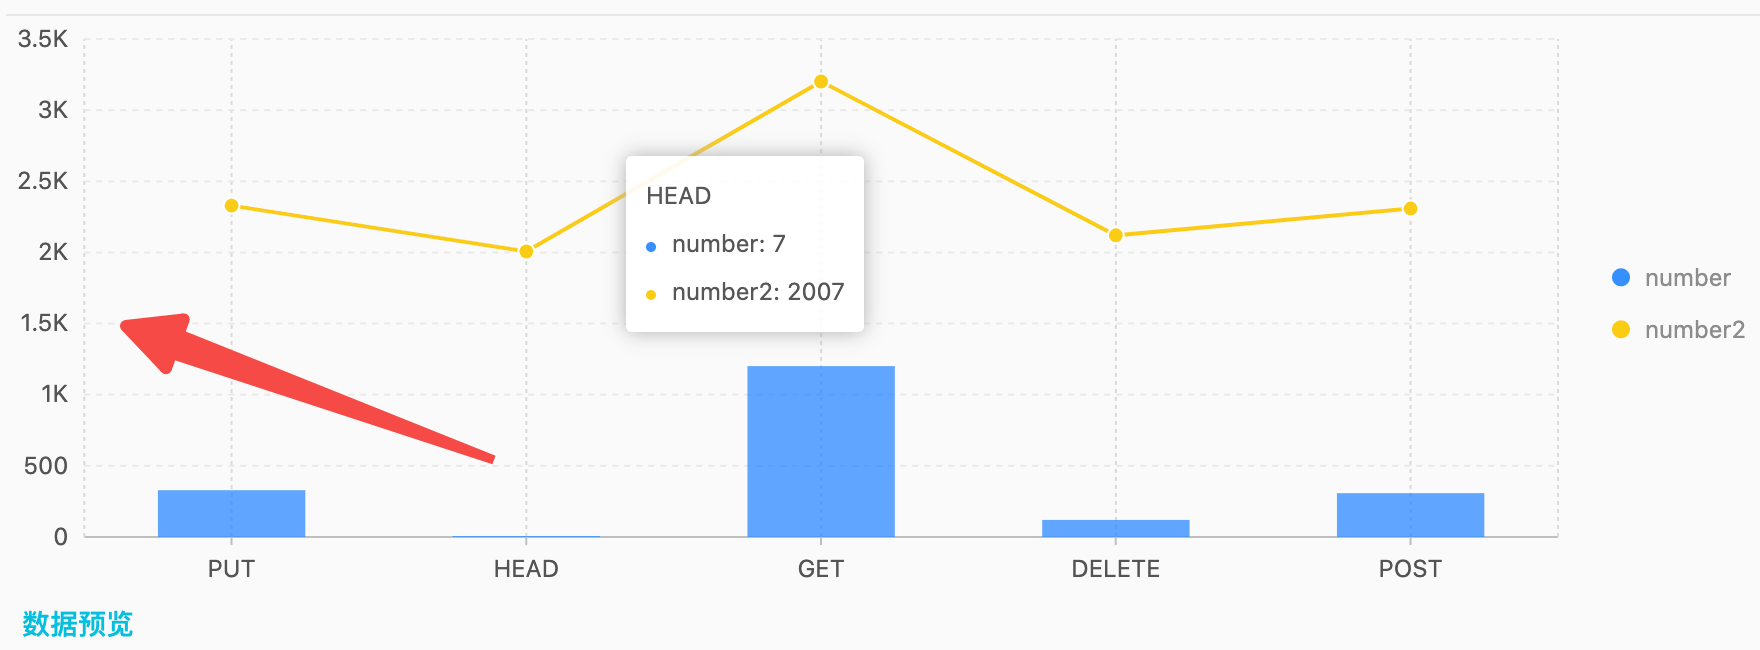 但是我找到的demo,https://bizcharts.net/gist/30GxPDHruMJ 图中绿色的点值为3 应该在红色的框内,而不应该在这个位置 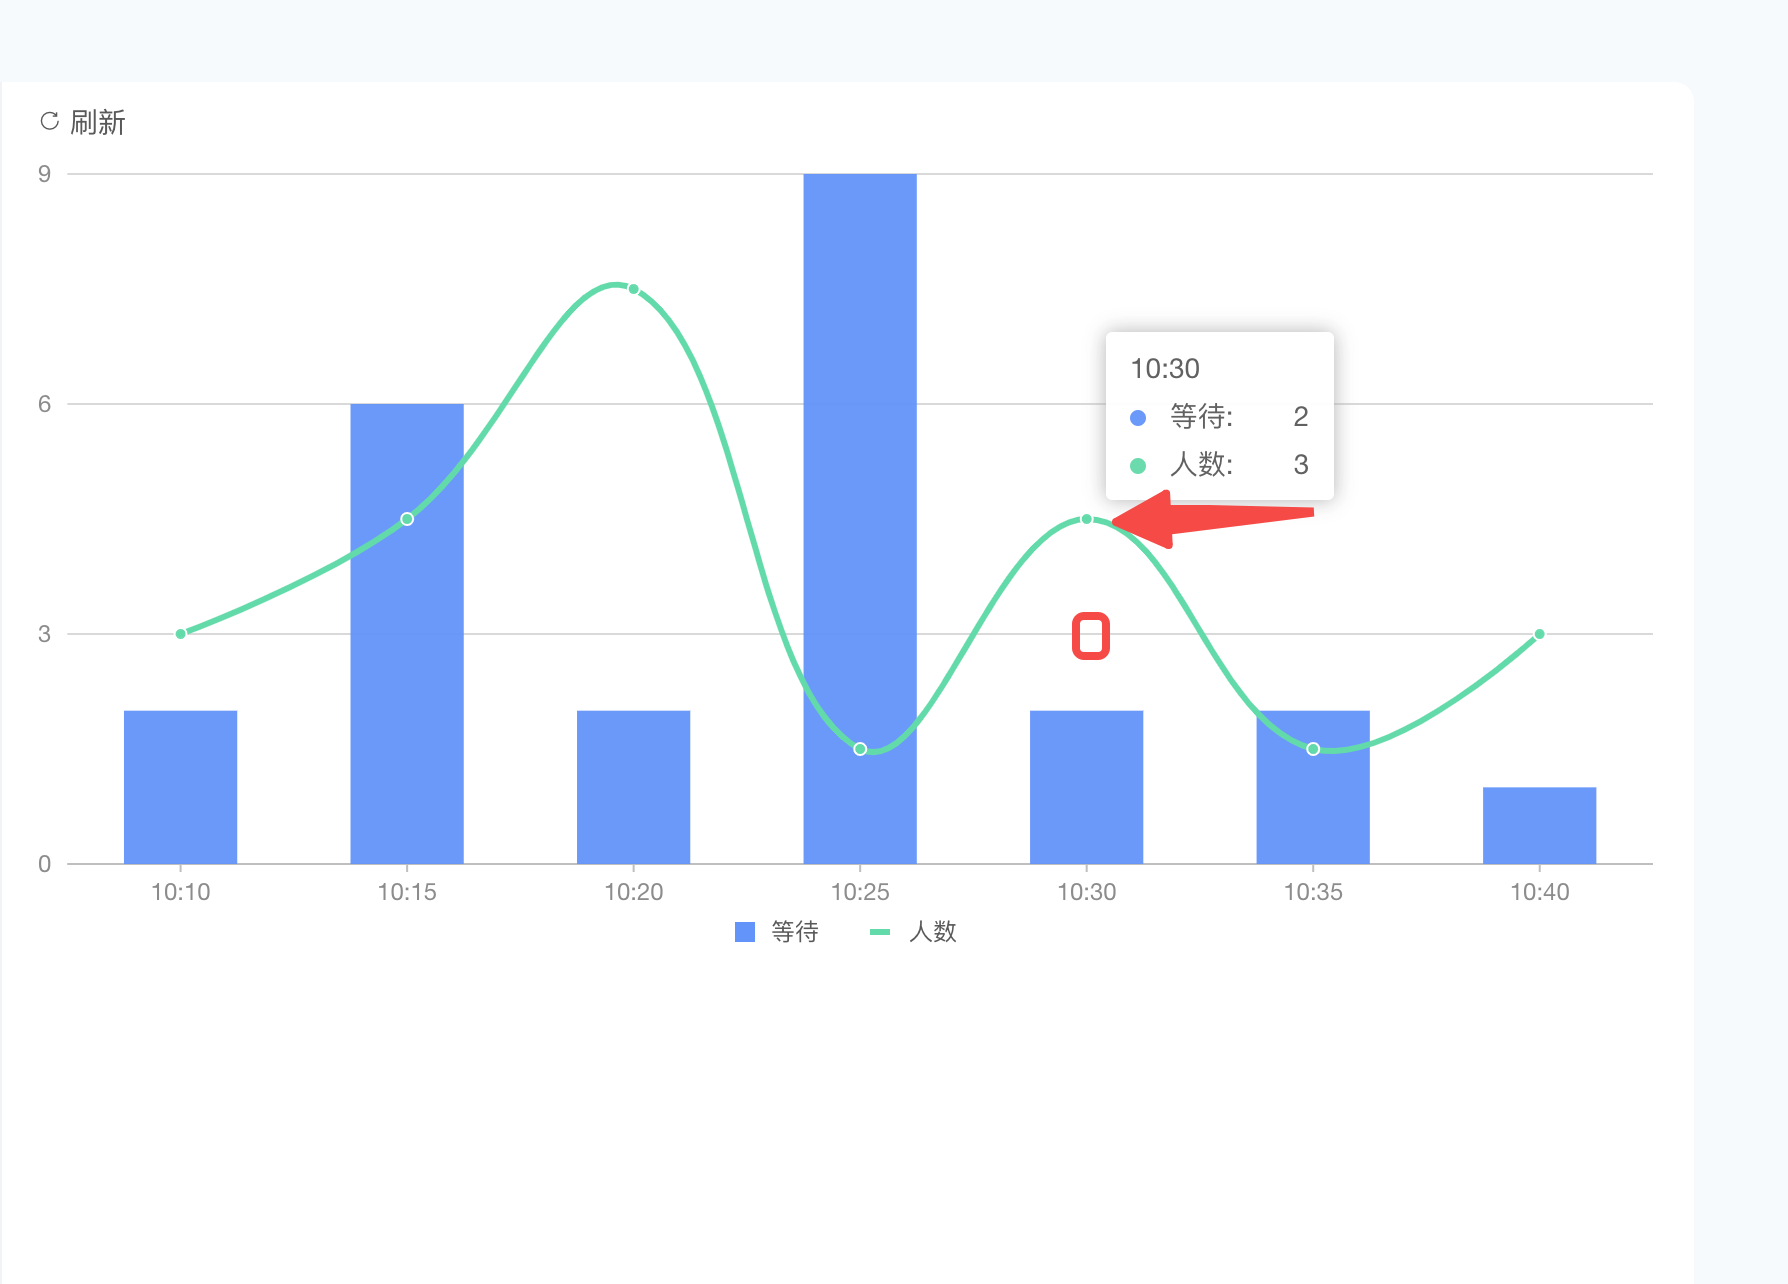
https://bizcharts.net/api/category/list?_csrf= timeout 很多接口超时了 蛋疼是也影响了API文档 导致打不开 需求 - 恢复官网访问 - API文档剥离出来,官网打不开应该不影响
BizCharts Version: Platform: Mini Showcase(like screenshots): forck and create a demo: https://bizcharts.net/gist/31k5qhNsURy 如题,我想点击Legend图例动态控制Interval每个分组的显隐,但是不知道如何获取Interval每个分组实例。 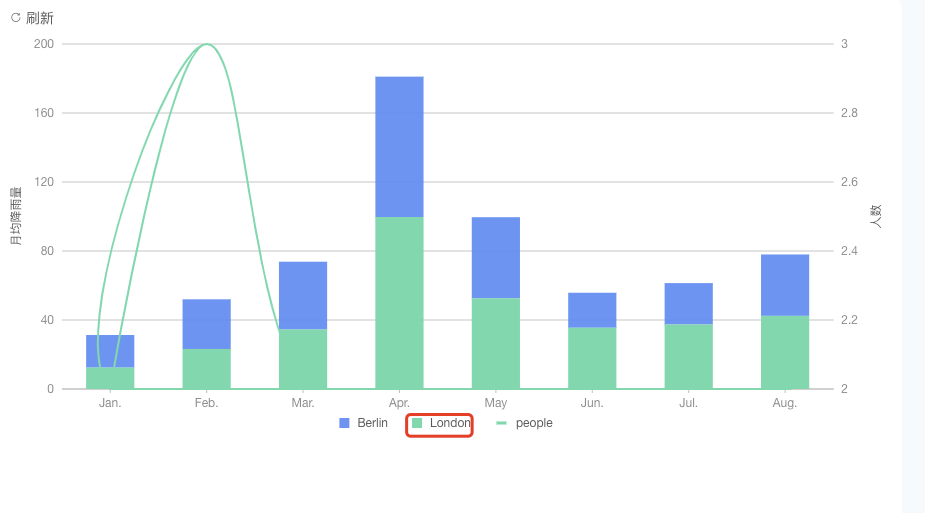
BizCharts Version:4 Platform: Mini Showcase(like screenshots): forck and create a demo: https://bizcharts.net/product/BizCharts4/demo/306 示例中的视图也是,数据更新了以后会刷新抖动一下,希望能清除历史数据直接更新视图。g2没有这个问题,数据更新后点运行不会抖动
BizCharts Version:4.1.11 Platform:windows Mini Showcase(like screenshots): forck and create a demo: https://bizcharts.net/product/BizCharts4/demo/306 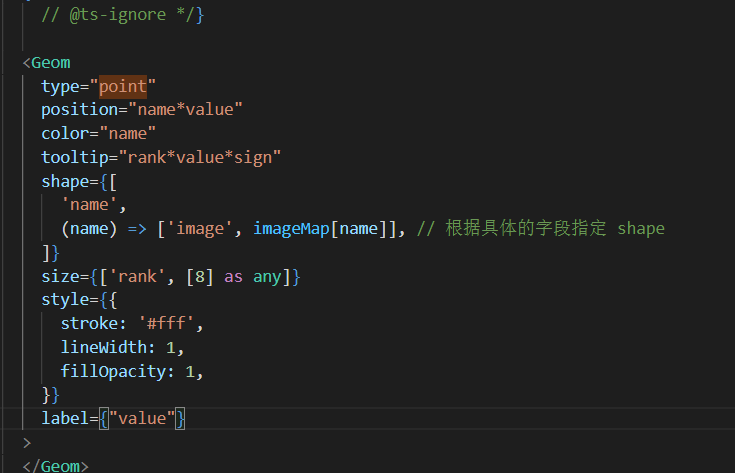 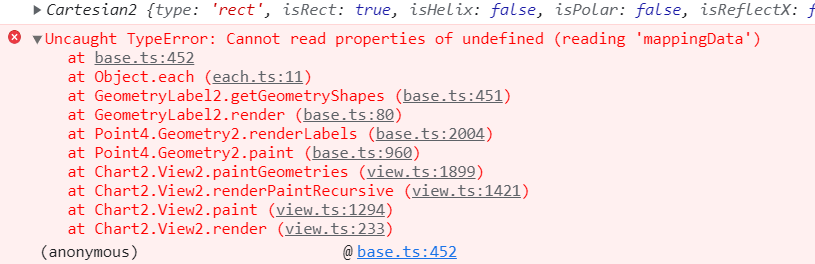 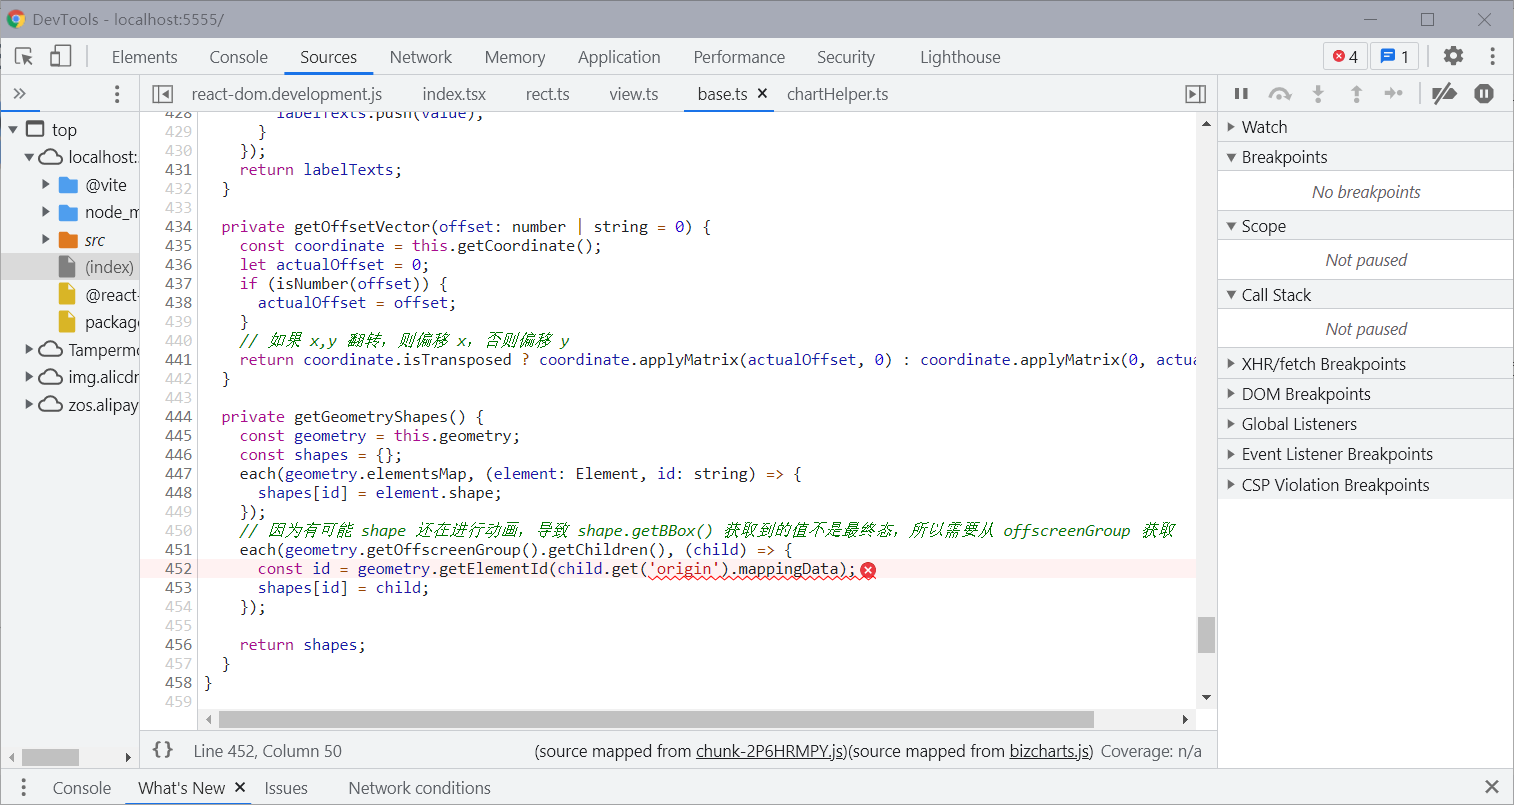 现在用的是registerShape自定义图像,在点击页面刷新后,图像会错位。 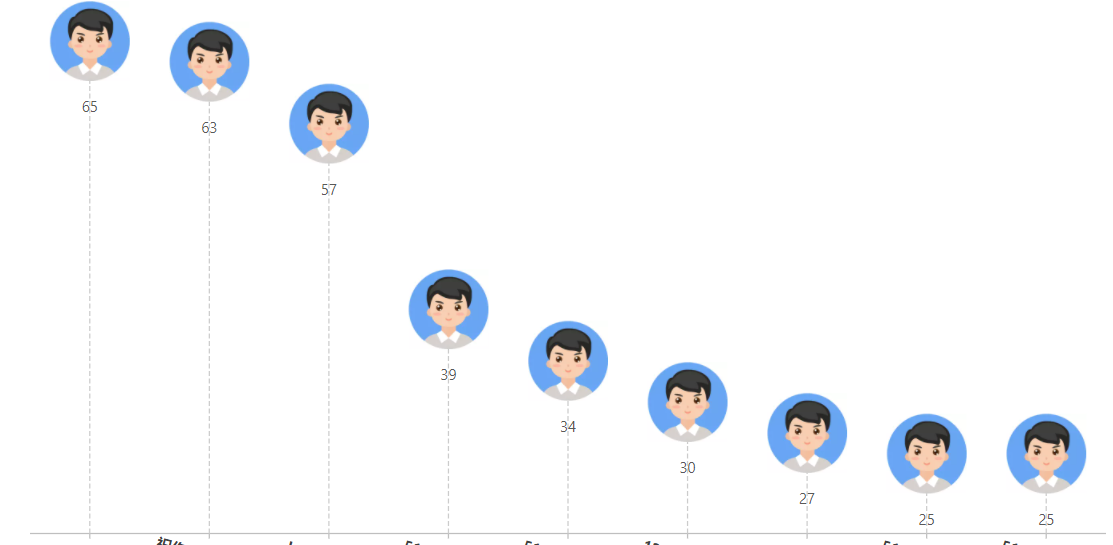 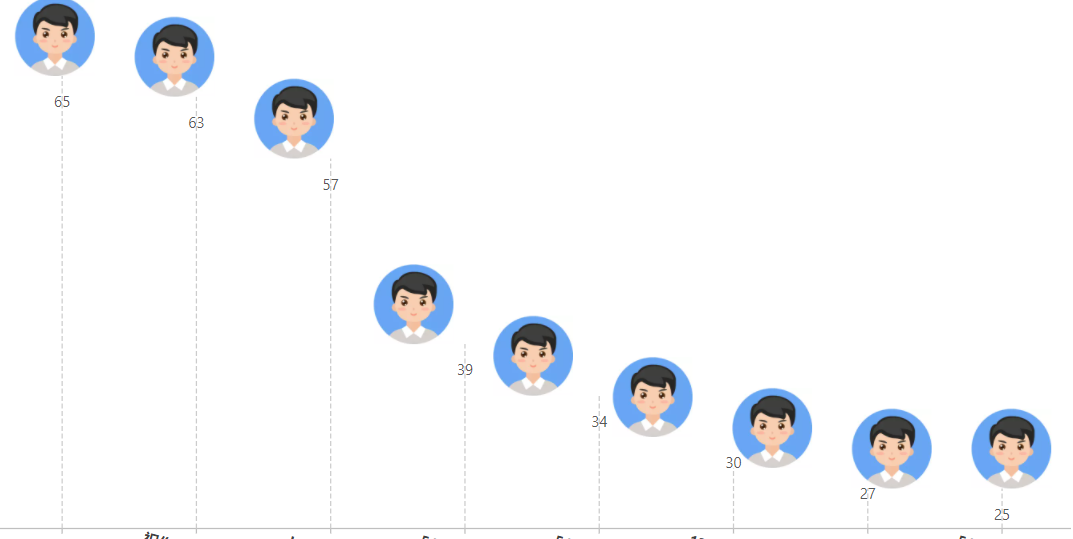 `registerShape('point', 'image', { draw: function (cfg, container) { cfg.points...
- bizcharts Version: 任意版本 chart上的 scale 发生变化 没有透传给View - CodePen Link: https://codepen.io/leanneCC/pen/LvJzdB
BizCharts Version: 4.x Platform: Mini Showcase(like screenshots): 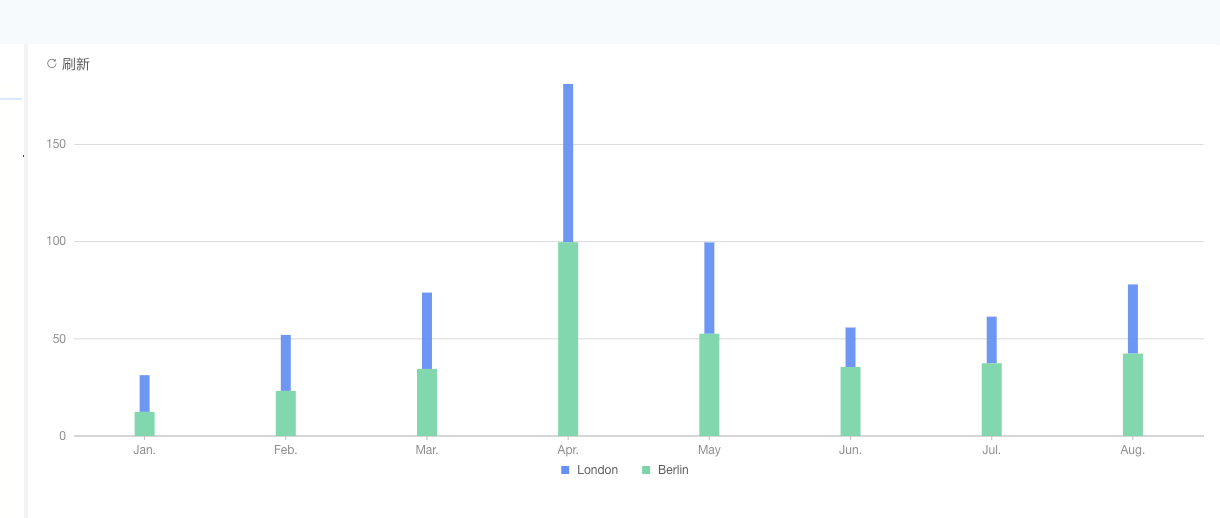 forck and create a demo: https://bizcharts.net/gist/30ypFSgd2d9 堆叠柱状图想设置一个宽度范围,根据官网文档提示设置后出现如图所示的问题,想问下堆叠柱状图的柱子宽度范围要怎么设置?
BizCharts Version: 4.x Platform: Mini Showcase(like screenshots): 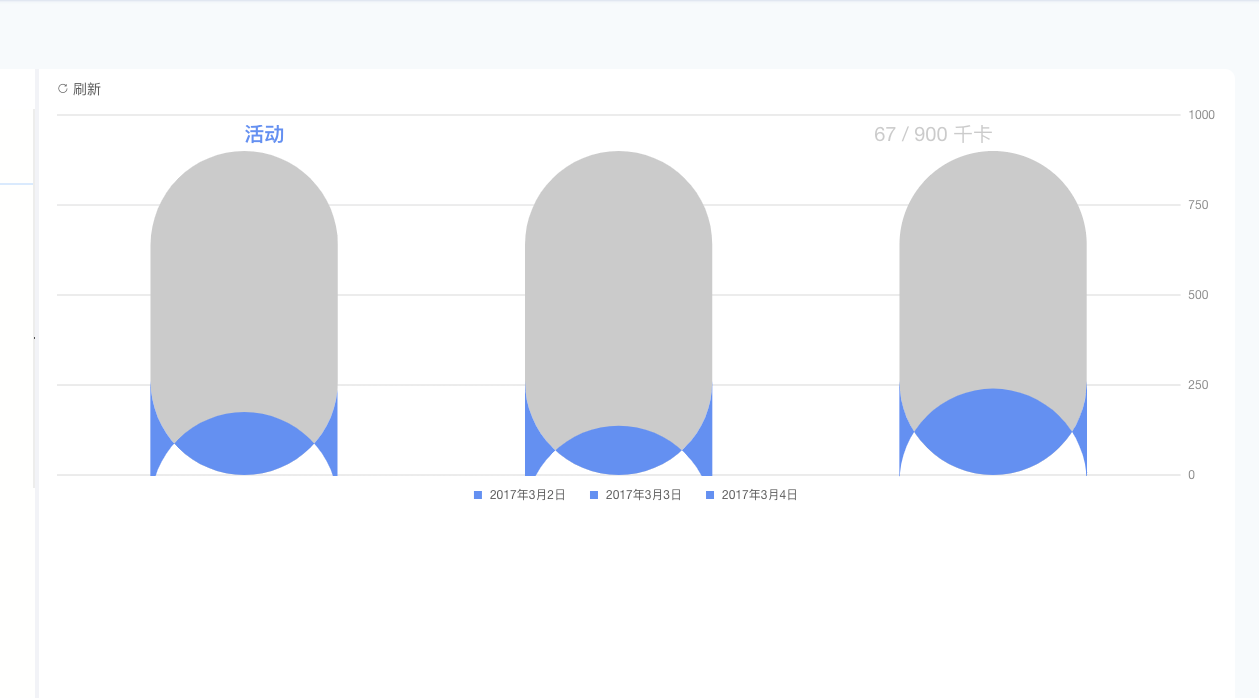 forck and create a demo: https://bizcharts.net/gist/30ygS0goLqB 如图,官网的圆角柱状图例子,减少数据量之后就会出现这个问题,这个要怎么解决?