BizCharts
 BizCharts copied to clipboard
Powerful data visualization library based on G2 and React.
BizCharts Version:4.x Platform:windows Mini Showcase(like screenshots):[ ![image]()](https://user-images.githubusercontent.com/56809499/147336070-b951ad64-d3cb-4897-b9a1-70b2633e2544.png)
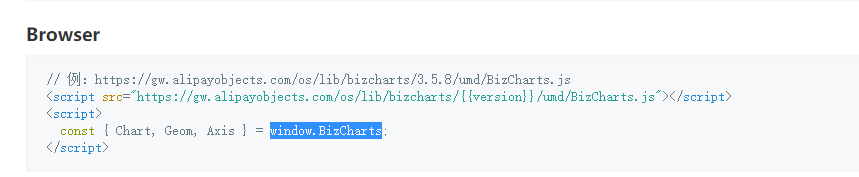 通过外部引用找不到window.BizCharts
BizCharts Version: 4.1.11 Platform: macOS Mini Showcase(like screenshots):  forck and create a demo: https://bizcharts.net/product/BizCharts4/demo/306

BizCharts Version: 4.x Platform: Mini Showcase(like screenshots): forck and create a demo: https://bizcharts.net/product/BizCharts4/demo/306
BizCharts Version: 4.x Platform: PC 4.x版本是否有支持图表鼠标点击拖拽时选择一个时间区间并回调该段区间选择的数据呢,目前看Slider组件没有onChange相关回调,3.x的SliderPlugin在4.x上已经不能用了
情景:暗色背景下,Slider的字体是黑色,且无法修改  复现:
BizCharts Version: 4.1.7 Platform: MacOS forck and create a demo: https://bizcharts.net/product/BizCharts4/demo/306 1. when set , onLineClick will be disabled; 2. when set , onLineClick will be disabled and onClick can...