lets-plot
 lets-plot copied to clipboard
Multiplatform plotting library based on the Grammar of Graphics
One of my favorite features of ggplot is the combination of facets and gghighlight, e.g. 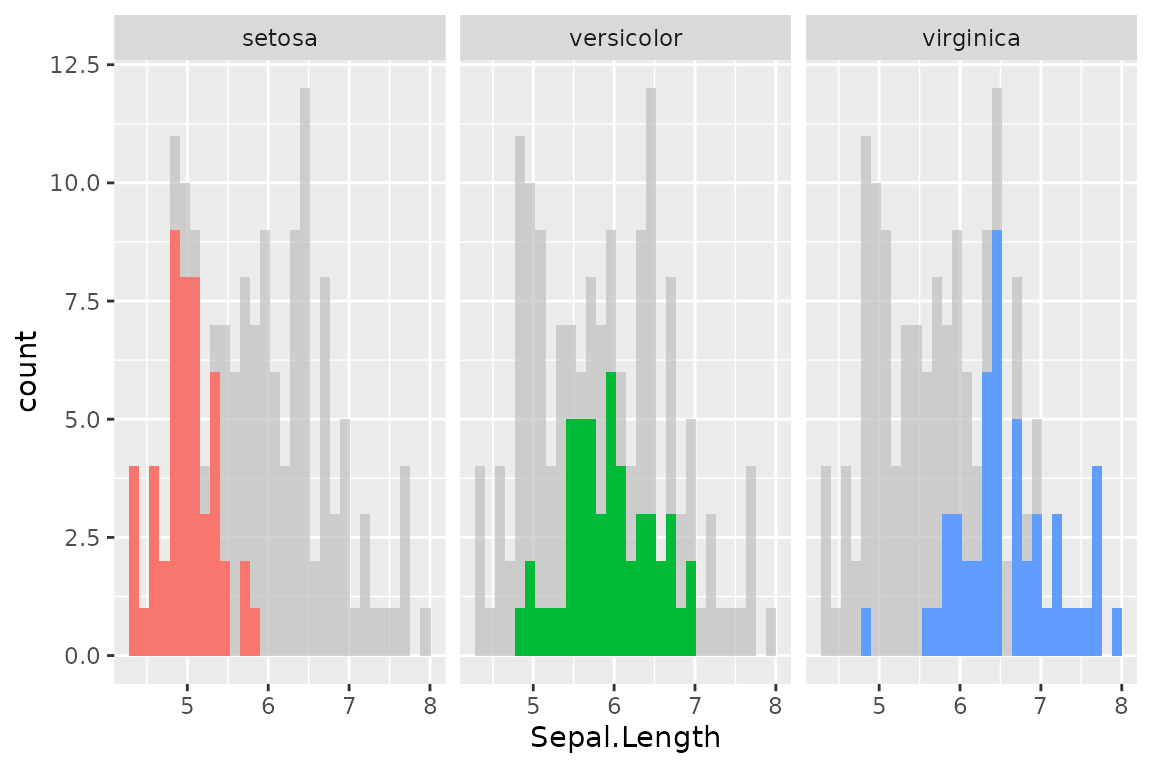...
Example: ```python data = { 'x': [0, 0, 1, 2], 'y': [0, 0, 1, 2], } ggplot(data, aes('x', 'y')) + geom_bin2d(bins=[2, 1]) + geom_point(color="red") ``` Expected: --- The same problem...

I'm try to build a conda package out of this library but using grayskull (see instructions [here](https://conda-forge.org/docs/maintainer/adding_pkgs/#generating-the-recipe)) I got the following error `AttributeError: There is no sdist package on pypi...
Example: ```python data = { 'x': ['a', 'a', 'a', 'b', 'b', 'b', 'c'], 'y': [0, 1, 2, -1, 0, 1, None], } ggplot(data) + geom_boxplot(aes('x', 'y', fill='x')) ``` Instead of...
Example: ```python data = { 'x': [0, 1], 'y': [0, 1], 'g': [0, 1e10], } ggplot(data, aes('x', 'y', color='g')) + geom_point() + scale_color_gradient(format=".2~s") ``` Output: Expected:
For Windows users, you have to install GTK in order to be able to export charts to PNG. Since this cannot be reflected in requirement files it adds a layer...
Example: ```python ggplot({'v': [1e10]}, aes(x='v')) + \ geom_point(aes(size='v'), y=0) + \ geom_text(aes(label='v'), y=1, size=10) + \ scale_size(trans='sqrt') ``` Output: Expected (like in ggplot2):
Example: ```python df = pd.DataFrame({ "x": pd.date_range(start="1-1-2000", end="1-1-2021", freq="10YE"), "y": [1, 3, 2], }) ggplot(df, aes("x", "y")) + geom_point() + scale_x_reverse() ``` Output: Without `scale_x_reverse()` formatting is correct:
Hi all when exporting plots as static assets (such as PNG), tooltips are obviously no longer working. So sometimes it would be handy to automatically (based on provided mappings) annotate/label...