lets-plot
 lets-plot copied to clipboard
Multiplatform plotting library based on the Grammar of Graphics
Lets-Plot 
Lets-Plot is an open-source plotting library for statistical data.
The design of Lets-Plot library is heavily influenced by Leland Wilkinson work The Grammar of Graphics describing the deep features that underlie all statistical graphics.
This grammar [...] is made up of a set of independent components that can be composed in many different ways. This makes [it] very powerful because you are not limited to a set of pre-specified graphics, but you can create new graphics that are precisely tailored for your problem.
- Hadley Wickham, "ggplot2: Elegant Graphics for Data Analysis"
We provide ggplot2-like plotting API for Python and Kotlin users.
Lets-Plot for Python
A bridge between R (ggplot2) and Python data visualization.
Learn more about Lets-Plot for Python installation and usage at the documentation website: https://lets-plot.org.
Lets-Plot for Kotlin

Lets-Plot for Kotlin adds plotting capabilities to scientific notebooks built on the Jupyter Kotlin Kermel.
You can use this API to embed charts into Kotlin/JVM and Kotlin/JS applications as well.
Lets-Plot for Kotlin at GitHub: https://github.com/JetBrains/lets-plot-kotlin.
"Lets-Plot in SciView" plugin


Scientific mode in PyCharm and in IntelliJ IDEA provides support for interactive scientific computing and data visualization.
Lets-Plot in SciView plugin adds support for interactive plotting to IntelliJ-based IDEs with the Scientific mode enabled.
Note: The Scientific mode is NOT available in communinty editions of JetBrains IDEs.
Also read:
What is new in 2.4.0
-
Python versions
Added Python 3.10 wheels as well as new Apple Silicon wheel for Python 3.9.
-
New Plot Types
-
Quantile-Quantile (Q-Q) plot.
- geometries:
geom_qq()geom_qq_line()geom_qq2()geom_qq2_line()
- quick Q-Q : the
qq_plot()function in thebistromodule.
See: example notebook.
- geometries:
-
Marginal plots.
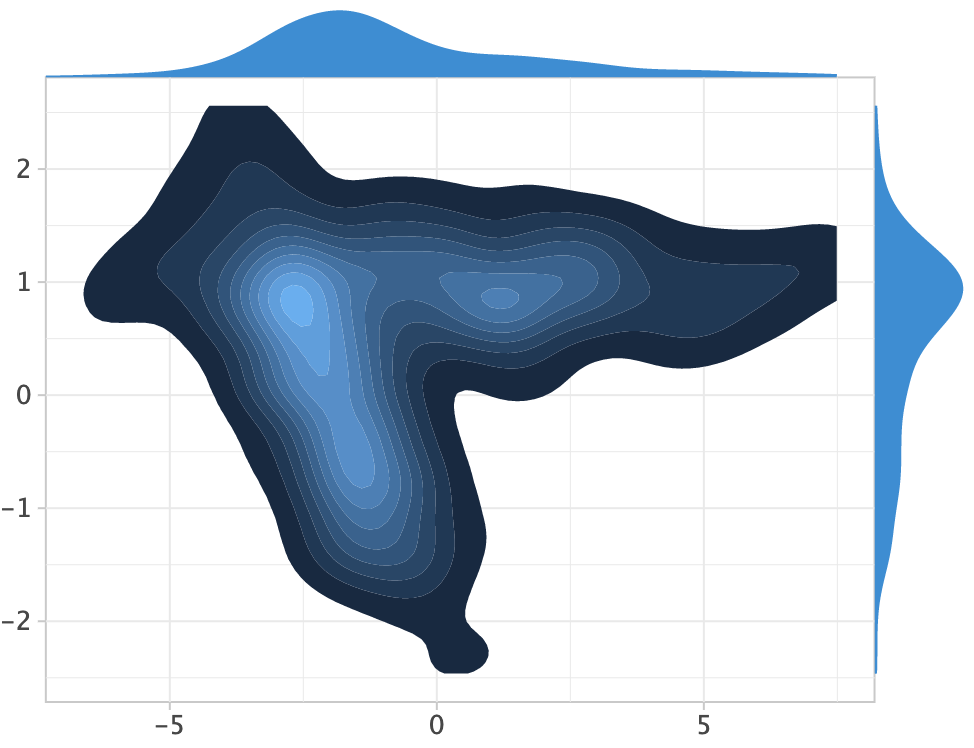
See: example notebook.
-
-
Plot Theme
-
faceparameter inelement_text().See: example notebook.
-
panel_borderparameter intheme().See: example notebook.
-
New options for configuring tooltip appearance.
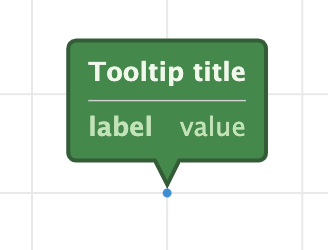
See: example notebook.
-
-
Color Scales
scale_color_gradientn()andscale_fill_gradientn()functions.See: example notebook.
Change Log
See CHANGELOG.md for other changes and fixes.
License
Code and documentation released under the MIT license. Copyright © 2019-2022, JetBrains s.r.o.