Evadzi
Evadzi
@TomLav , apologies for the delay in responding to your earlier questions. You may be able to plot maps from any projection ("plot_map" operation). But you wont be able to...
@forman I got those error messages when I specified the region constraints for both the Ozone L3 merged and Landcover as lon -20, 20 lat -20, 20. I tried today...
Issue resolved in cate 2.0.0-dev 22 --- 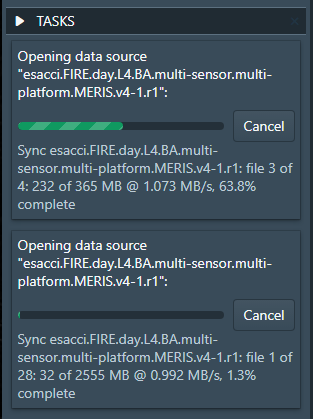 But progress bar doesn't get filled in for ocean colour dat ------ 
progress bar now get filled in for ocean data as well ----- 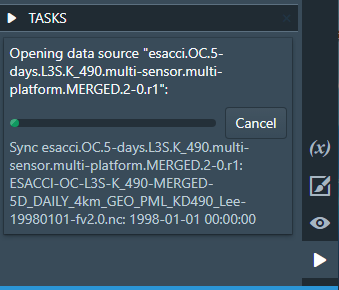 **Specifications** cate-2.0.0-dev-23 Windows 10
@HelenClifton ..Issue not resolved.. I tried again downloading from ODP using the cate-2.0.0-dev.23 GUI and Windows 10  **It returns the same error as before:** *Job: Opening data source "esacci.LC.5-yrs.L4.LCCS.multi-sensor.multi-platform.Map.1-6-1.r1"...
@forman I will close this issue because I was able to download the global landcover data as recommended by @HelenClifton . I suspect an issue with the subset function(currently noticed...
.....I am still having issues; both global and regional constraints… Job: Opening data source "esacci.LC.13-yrs.L4.WB.asar.Envisat.Map.4-0.r1" Message: NetCDF: Access failure Code: -32003 Method: set_workspace_resource Exception: RuntimeError ``` Traceback (most recent call...
> Can I get the dataset? Or something representative? Otherwise I haven't been able to reproduce it with any of the ODP datasets I've tried. *I emailed CO2 data to...
@JanisGailis Thank you. yes for now the line y=ax+b that best fits a data set in the least squares sense is okay. In the future with regards to the plot()...