Tzach Livyatan
Tzach Livyatan

*Installation details* Dashboard Name: Cluster View Scylla-Monitoring Version: 3.7.0 Scylla-Version: 2021.1 the top bar show selector for: node restart, stall detector, schema change etc  It is not clear what...
Please make sure that this is a feature request. **Describe the feature and the current behavior/state.** https://github.com/scylladb/scylla-monitoring/pull/1296 introduce reporting a *scylla* issue But the information is minimal. We want to...
**Describe the feature and the current behavior/state.** Inspired by https://github.com/scylladb/scylla-monitoring/pull/1196 A button "Upload Metric" will upload the data to a **protected** bucket, as describe here https://docs.scylladb.com/troubleshooting/report_scylla_problem/#metrics-reports **Who will benefit with...
Please make sure that this is a feature request. **System information** - Are you willing to contribute it (Yes/No): Yes **Describe the feature and the current behavior/state.** As many of...
Copy @bentsi main here With the digram plugin https://grafana.com/grafana/plugins/jdbranham-diagram-panel to represent similar data to the node table, in a more visual way 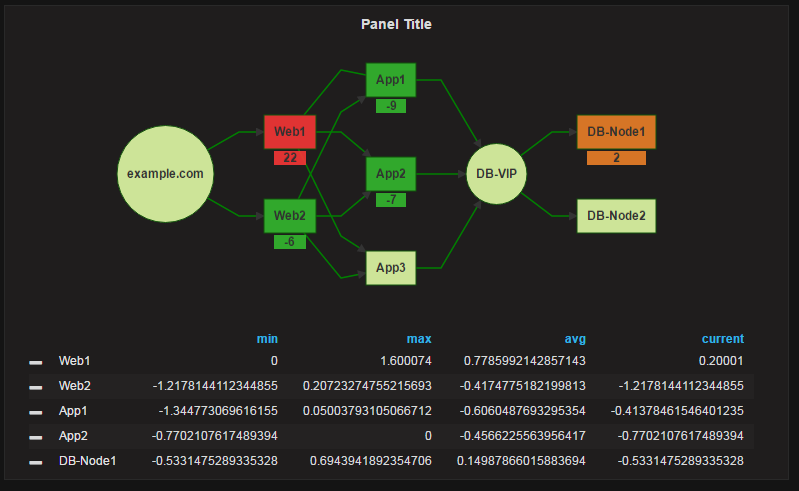 we can represent the cluster/DC/racks and Scylla...
When running on a K8s environment, standard tools, like Helm should be used. See for an example of using Helm to run Prometheus and Grafana on K8s https://medium.com/@chris_linguine/how-to-monitor-your-kubernetes-cluster-with-prometheus-and-grafana-2d5704187fc8
- Add sizing (CPU, Storage) recommendation for Loki base on the number of Scylla cores and retention time. - Loki storage should be place outside the docker container (similar to...
On a multi region cluster, it would be nice to present the nodes on a world map  https://grafana.com/grafana/plugins/grafana-worldmap-panel Question is: where do we get the location from?
The default of the current start_all is running both Prometheus and Grafana with default no auth. This make it easier to start with, but also easier to forgot to secure...
Its look like "-u" is used for both USE_UNSET https://github.com/scylladb/scylla-tools-java/blob/master/src/java/com/scylladb/tools/BulkLoader.java#L1005 and USER_OPTION https://github.com/scylladb/scylla-tools-java/blob/master/src/java/com/scylladb/tools/BulkLoader.java#L983