calplot
 calplot copied to clipboard
Calendar heatmaps from Pandas time series data.

In this example I'd like to set the non month days to dark gray instead of white? Is that possible? I tried dropzero=True and false, it appears to only affect...
Can you please add a vertical version of this calendar plot?
With a time-series whose frequency is  the following instructions ```python #pyplot.figure(figsize=(16,10), dpi= 80) ; calplot.calplot( mod09ga_surface_reflectances['mod09ga_surface_reflectance_1'], how='count', suptitle='Number of daily MOD09GA observations (pixels)', suptitle_kws={'color':'dimgray', 'fontsize':14}, vmin=0, cmap='gist_gray_r', fillcolor='whitesmoke', linewidth=0.5,...
Calplot version 0.1.7.2 / Windows 10: Using a suptitle for a plot truncates it at the top: [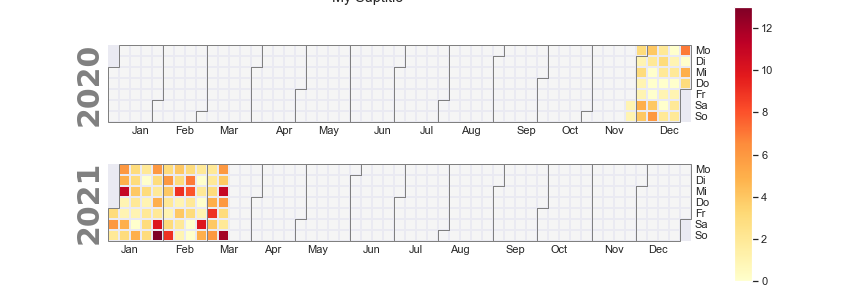](https://postimg.cc/14R6Jg3h) This is the code I use: ``` fig, ax = calplot.calplot(dfYear.squeeze(), cmap='YlOrRd',...
Great capability. TimeZone Aware message is shown even though the index is timezone aware? ``` lib\site-packages\calplot\calplot.py:189: FutureWarning: Indexing a timezone-aware DatetimeIndex with a timezone-naive datetime is deprecated and will raise...
This should fix https://github.com/tomkwok/calplot/issues/4. The issue seems to be that plt.tight_layout() and fig.subplots_adjust() do not work well with each other. I have to admit it's not the most beautiful code,...
Hi, Using your examples I've found that if you specify more than one year and a colorbar the output image is shifted to the left so that only half of...
This is a very small change, but it allows the user to add a label to the colorbar directly from the function call. This way, you can label all your...
It would be nice to add a label to the colorbar. That way you could make it say "_ per day" or "number of _" or whatever you wish to...
I just want to show data from Monday-Friday. How can I do that?