szcf-weiya
szcf-weiya
在解决问题 #5 时,曾尝试过在 `.cls` 文件中不使用 `\makeatletter` 和 `\makeatother`,但会报错,加上后不会。

  ```R > heidel.diag(mcmc(beta)) Stationarity start p-value test iteration var1 passed 1 0.335 Halfwidth Mean Halfwidth test var1 passed 2.47 0.0434 ```
```R > geweke.diag(mcmc(beta)) Fraction in 1st window = 0.1 Fraction in 2nd window = 0.5 var1 -0.6483 ```
https://github.com/szcf-weiya/MonteCarlo/blob/5b82f2035d625eb7768211c856c7b9cfb4056851/MCOptim/rand-logit.R#L132-L133 - sample sigma comes from the following conditional dist. https://github.com/szcf-weiya/MonteCarlo/blob/5b82f2035d625eb7768211c856c7b9cfb4056851/MCOptim/rand-logit.R#L101-L104 https://github.com/szcf-weiya/MonteCarlo/blob/5b82f2035d625eb7768211c856c7b9cfb4056851/MCOptim/rand-logit.R#L135-L136 - sample beta might be related to the fisher's information (but seems still different. QUESTION)
plot|cumuplot --|-- 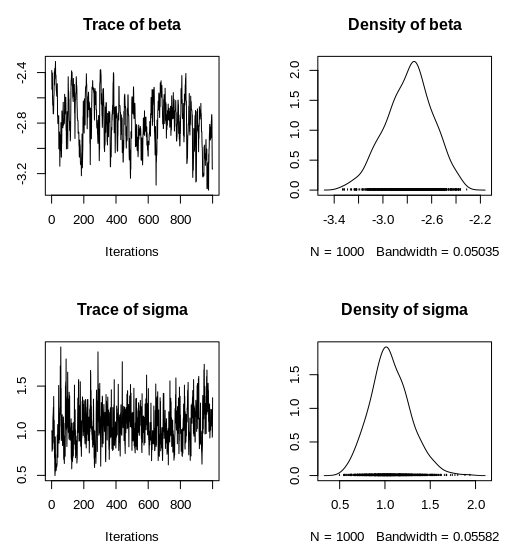|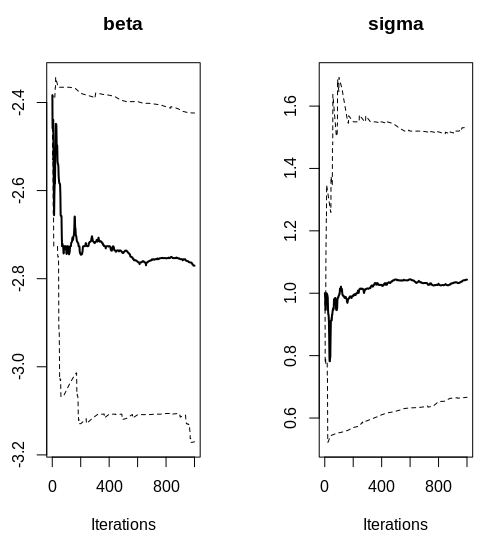 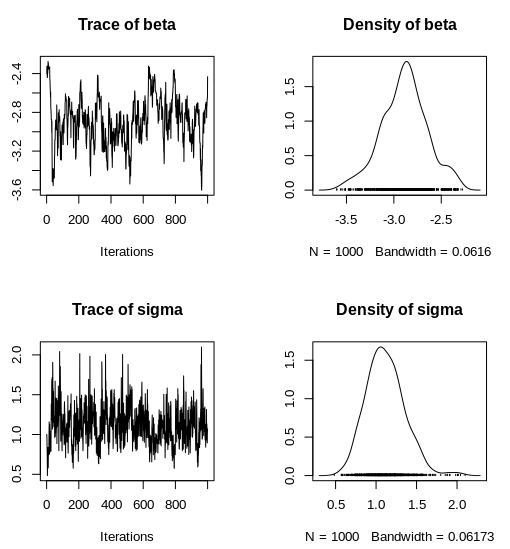|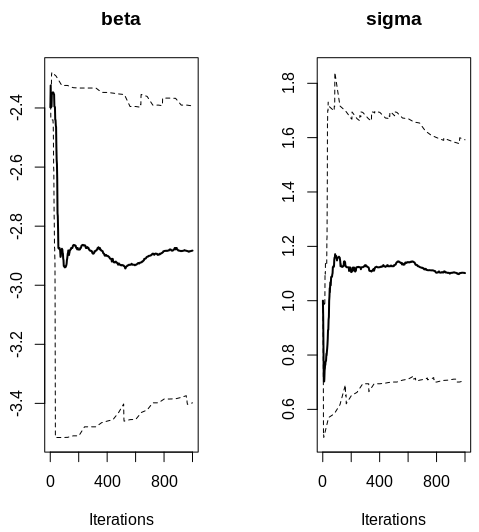 the first try (row 1) returns a larger bias in beta, and the second try (row 2) gives a larger bias of sigma.
Derivation of Q function.
 ```r iter = 2 , diff = 0.3448811 iter = 3 , diff = 0.0660542 iter = 4 , diff = 0.04427646 iter = 5 , diff = 0.01623779...
with scale = 0.1, all test passed, ```r Fraction in 1st window = 0.1 Fraction in 2nd window = 0.5 var1 0.6041 Stationarity start p-value test iteration var1 passed 1...
