Bright
Bright
> issue: #9304 > > @startryst can you test this PR? Great, I'd love to, but after check it out a while, still couldn't figure out how, can you let...
> > can you let me know how to install the plug-in manually? > > you either install @NoahTroy branch > > * `git clone https://github.com/NoahTroy/netdata --branch=vnstat-plugin netdata_vnstat` > *...
> @NoahTroy could you take a look at @startryst suggestion? > > > [#8955 (comment)](https://github.com/netdata/netdata/pull/8955#issuecomment-644123972) Also, check it out below for another example of the visualization from vnstat, I would...
> @ilyam8 @startryst Sounds good, I should have those changes done by the end of the day. Would you like me to pull the latest version of Netdata (I forked...
> @startryst Not right now, although they will be: I undid the last commit so those files aren't there anymore. Once I have everything done, I'll commit it all at...
> By the way, I'm working on it right now, and I noticed that there isn't a bar graph option (unless I'm missing it) Yeah, the bar chart I shared...
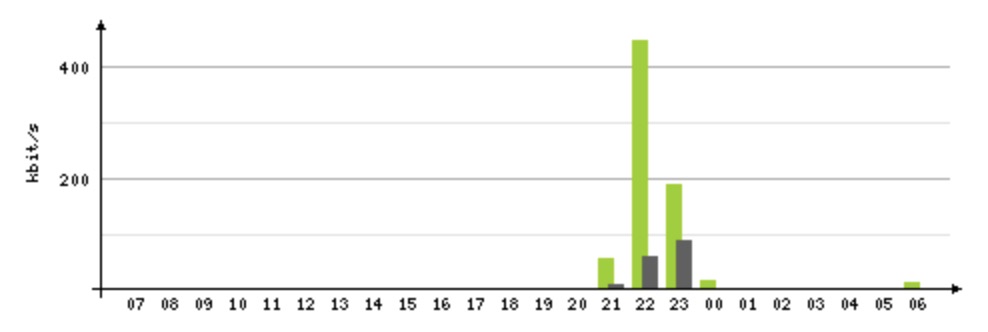 Do you think if we can have three diagrams like something above, where the X-axis's unit will be hour, day and month...
let me re-phrase what's relevant to me(the above looks a bit of messy in terms of messaging), so the below data is the hourly, daily and monthly statistics, so if...
> Alright @startryst , I'm just running a final test and then I'll push the updated plugin. I've added the following charts: > > All time Total vs. Total RX...
> @startryst Okay, feel free to try it out now and let me know what you think. I'll make any changes you suggest, in the morning. On it. Assume the...