feature request for embedding_density()
Hi @LuckyMD, I'm trying out embedding_density() using the latest scanpy version.
First of all, this is a wonderful feature - thank you!
Second, I was wondering if it would be possible to extend this and create a 'differential density' to visualize differences between two conditions? (possibly on a lower resolution grid?)
btw. there is a typo on https://icb-scanpy.readthedocs-hosted.com/en/latest/index.html under Master: the name is switched to 'density_embedding()
Thanks for the heads up for the typo. That is fixed now.
About the feature request... this is not entirely straightforward. The challenges to do this are:
- As densities are calculated relative to the sample (or the category subset from
.obs), the values are not directly comparable. For example, you would get a value of 0.5 if you subtract the maximum density in one condition from a density of half the maximum in the other condition... but maybe the overall density is higher in the second condition. You could just interpret this as the relative differences within the samples I guess... - Densities are currently calculated over cells... to subtract one from the other, you'd have to interpolate this to a grid layout.
- Ideally you'd want some kind of statistical test on differential densities... that's a whole other question...
What do you think about the above points? If this were implemented, it probably wouldn't be a matter of a day or so... as I'm a bit low on time at the moment, I wouldn't be able to implement this in the next month even if we did find a good way forward unfortunately. You are welcome to submit a pull request though...
Thanks- that doesn't seem to be as easy as I was thinking..
- I think for most applications that I have in mind I would be interested in the relative differences. Are cells distributed differently in two conditions, regardless of whether there are more cells overall in one of the conditions?
- My bad, I thought the were already calculated over a grid layout.. would that also require to down sample the larger cell population to match the smaller one?
- That would be very cool, but having this for qualitative assessment would be already useful
Ok, thanks - will do if I come up with a satisfying solution.
I'm enjoying this brainstorming session... let's continue.
I think the most difficult part would be the grid plotting in the end, but let's continue with the points in order.
-
We may need to rethink the scaling. At the moment it's scaled such that 1 is the highest density in one sample. Maybe it's more informative to make all sample densities to sum to 1 for this comparison? I didn't implement that currently as it's currently calculated over cells... if it were over grid points, then each condition would have the same number of grid points and this would be feasible again.
-
I'm not even sure if sampling is necessary... you could just as well take average densities in a grid square. That would make the calculation fairly easy. The issue, as I alluded to above, is plotting that grid I think. At the moment I can easily use scanpy's inherent
plot_scatter()function... I'm not aware of any grid plotting function. That would probably need to be custom made. -
A simple statistic would just be to use the outliers of the differences... but there are definitely better ideas...
Thanks for your thoughts on this!
- That seems like a good approach - the size of the grid cells would be adjusted for each plot depending on cell number?
- This probably depends a lot on the kind of dataset and comparison one wants to make: Does one want to know if there are any differences at all or also where on the grid these difference are? Up to now my approach was to use clusters as 'grid' and calculate the differences in proportion of cells per cluster across two or more conditions. The reason that I like your approach is that it is a very good (qualitative) visualization and much more subtle then just binning the data based on clusters. It seems hard to capture this visual aspect with a statistic.
- You could create a heuristic grid size depending on cell numbers, or it's probably easier to just put grid dimensions as a user parameter with some (low) default value.
- I've been approaching this from the perspective that you care about where the densities occur on the visualization. That's why you can change the
basisfor the calculations and plotting. From my perspective, calculating densities over clusters and comparing these is actually just a sub-optimal replacement for testing for differential compositions. This is a separate problem, where the data should be modeled statistically, accounting for the compositional nature of the data. So sticking to the visualization is probably the right way forward for this function. On that note... we could use a seaborn heatmap function to plot the differential grid points.
Overall I reckon we are moving toward a new plotting function here which does some calculations on the backend. Something like sc.pl.embedding_density_diff() where you take the output from sc.tl.embedding_density() and interpolate to a grid layout, rescale to sum to 1 across each grid separately, take the diff of two conditions, and then plot everything in a heatmap. Doesn't seem as difficult as I thought. I will get onto this when (read: if) I (ever) have some spare time 😉.
@LuckyMD, have you checked out datashader? I think it's set up to do a lot of the things you're talking about here. In general, it gives you a principled framework for visualizing many points, including how to aggregate points that overlap.
Looks super cool... but also like a heavy dependency. Do you think it would be worth using datashader when we are just looking for a simple additional function?
Definitely a heavy dependency, you should see the size of the conda environment you need to test it.
I think it'd be useful for playing around with ideas on how you'd like to aggregate and scale the values, since they've already got a bunch of methods implemented. Plus the plots often look pretty good.
That is a good suggestion, but might be difficult with regards to time commitment...
I think I've got an example for you, which should be pretty easy for you to play around with in datashader.
The example is doublet detection. I'm following the basic outline of the methods which simulate doublets, then project those onto the real data to find which barcode (/cell) the simulated doublets sit next to. Those barcodes are presumed to be doublets.
So we'd expect that areas of mostly singlets in the real data would have a lower relative (to the real data) density of points in the simulated. I'm still exploring what the best way to summarize that difference in density is through.
Here's an example with some pbmcs from 10x:
Setup (loading, simulating, and projecting)
import scanpy as sc
import numpy as np
import pandas as pd
from scipy import sparse
from umap import UMAP

from itertools import repeat, chain

# Define functions

def preprocess(adata):
    adata.var["mito"] = adata.var["gene_symbols"].str.startswith("MT-")
    sc.pp.calculate_qc_metrics(adata, qc_vars=["mito"], inplace=True)
    sc.pp.normalize_per_cell(adata, counts_per_cell_after=10000)
    sc.pp.log1p(adata)
    return adata

def pca_update(tgt, src, inplace=True):
    # TODO: Make sure we know the settings from src
    if not inplace:
        tgt = tgt.copy()
    if sparse.issparse(tgt.X):
        X = tgt.X.toarray()
    else:
        X = tgt.X.copy()
    X -= np.asarray(tgt.X.mean(axis=0))
    tgt_pca = np.dot(X, src.varm["PCs"])
    tgt.obsm["X_pca"] = tgt_pca
    return tgt

def simulate_doublets(adata, frac=.5):
    """Simulate doublets from count data.

    Params
    ------
    adata
        The anndata object to sample from. Must have count data.
    frac
        Fraction of total cells to simulate.
    """
    m, n = adata.X.shape
    n_doublets = int(np.round(m * frac))
    pos_idx = np.array(list(chain.from_iterable(map(lambda x: repeat(x, 2), range(n_doublets)))))
    combos = np.random.randint(0, m, (n_doublets * 2))
    pos = sparse.csr_matrix(
        (np.ones_like(combos, dtype=adata.X.dtype), (pos_idx, combos)),
        shape=(n_doublets, m)
    )
    dblX = pos * adata.X
    # TODO: Downsample total counts
    srcs = np.sort(combos.reshape(n_doublets, 2), axis=1)
    obs = pd.DataFrame(srcs, columns=["src1", "src2"])
    var = pd.DataFrame(index=adata.var_names)
    return sc.AnnData(dblX, obs=obs, var=var)

# Load data

# http: // cf.10xgenomics.com/samples/cell-exp/3.0.0/pbmc_10k_v3/pbmc_10k_v3_filtered_feature_bc_matrix.h5
pbmc = sc.read_10x_h5("./data/10x/pbmc_10k_v3_filtered_feature_bc_matrix.h5")
pbmc.var["gene_symbols"] = pbmc.var.index
pbmc.var.set_index("gene_ids", inplace=True)

dblt = simulate_doublets(pbmc)
dblt.var["gene_symbols"] = pbmc.var["gene_symbols"]

pbmc.raw = pbmc
dblt.raw = dblt

pbmc = preprocess(pbmc)
dblt = preprocess(dblt)

sc.pp.pca(pbmc)
pca_update(dblt, pbmc)

umap = UMAP()
pbmc.obsm["X_umap"] = umap.fit_transform(pbmc.obsm["X_pca"])
dblt.obsm["X_umap"] = umap.transform(dblt.obsm["X_pca"])

sc.tl.embedding_density(pbmc, "umap")
sc.tl.embedding_density(dblt, "umap")
Getting setup for datashader plots (much shorter) :
Make dataframe:
pbmcdf = pd.DataFrame(pbmc.obsm["X_umap"], columns=["x", "y"])  # Real data
dbltdf = pd.DataFrame(dblt.obsm["X_umap"], columns=["x", "y"])  # Simulated doublets

pbmcdf["density"] = pbmc.obs["umap_density"].values
dbltdf["density"] = dblt.obs["umap_density"].values
Get plotting imports and canvas:
import datashader as ds
from datashader import transfer_functions as tf
from bokeh import palettes

canvas = ds.Canvas(plot_width=300, plot_height=300,
                   x_range=(pbmcdf["x"].min() - .5, pbmcdf["x"].max() + .5),
                   y_range=(pbmcdf["y"].min() - .5, pbmcdf["y"].max() + .5),
                   x_axis_type='linear', y_axis_type='linear')
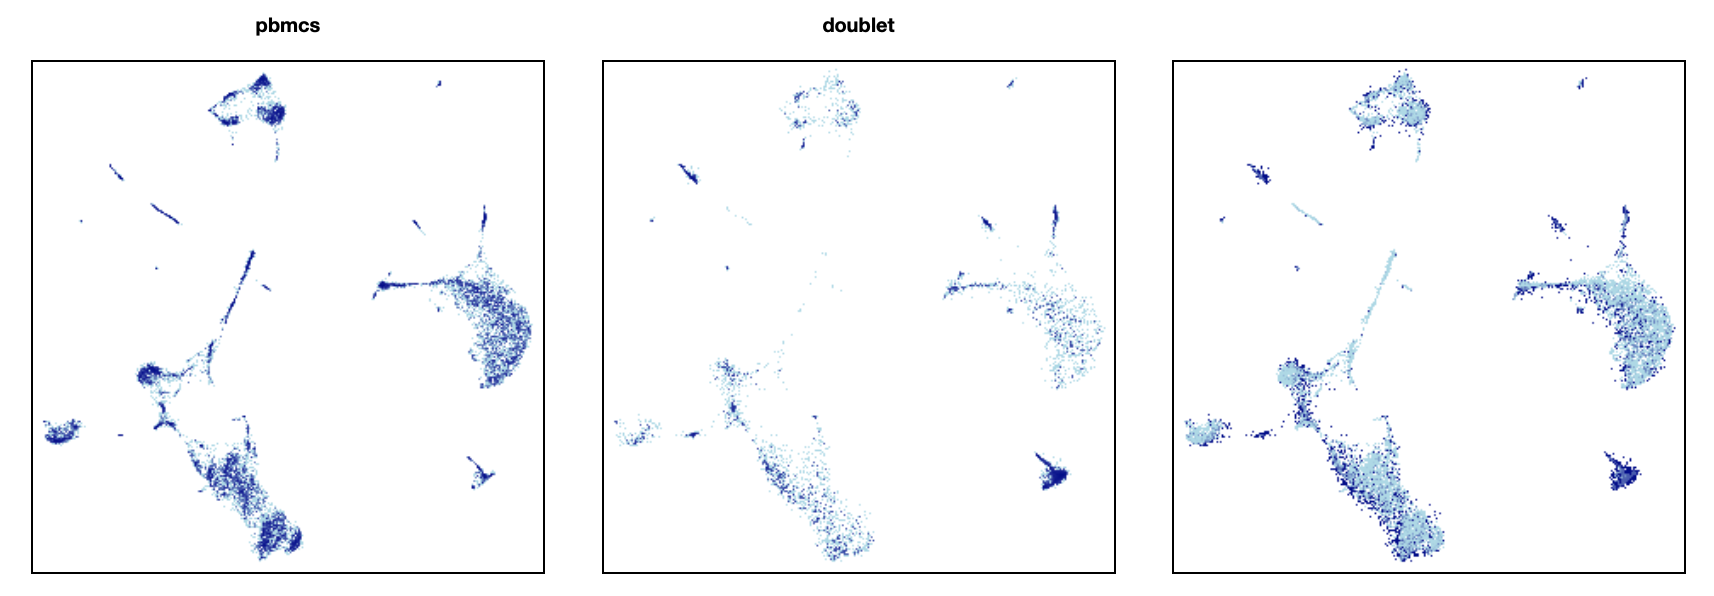
First, something simple. Basically just a 2d histogram with 300 x 300 bins:
real = canvas.points(pbmcdf, 'x', 'y', ds.count())
sim = canvas.points(dbltdf, 'x', 'y', ds.count())

tf.Images(
    tf.shade(real, name="pbmcs"),
    tf.shade(sim, name="doublet"),
    tf.shade(sim / (real + sim)),
)
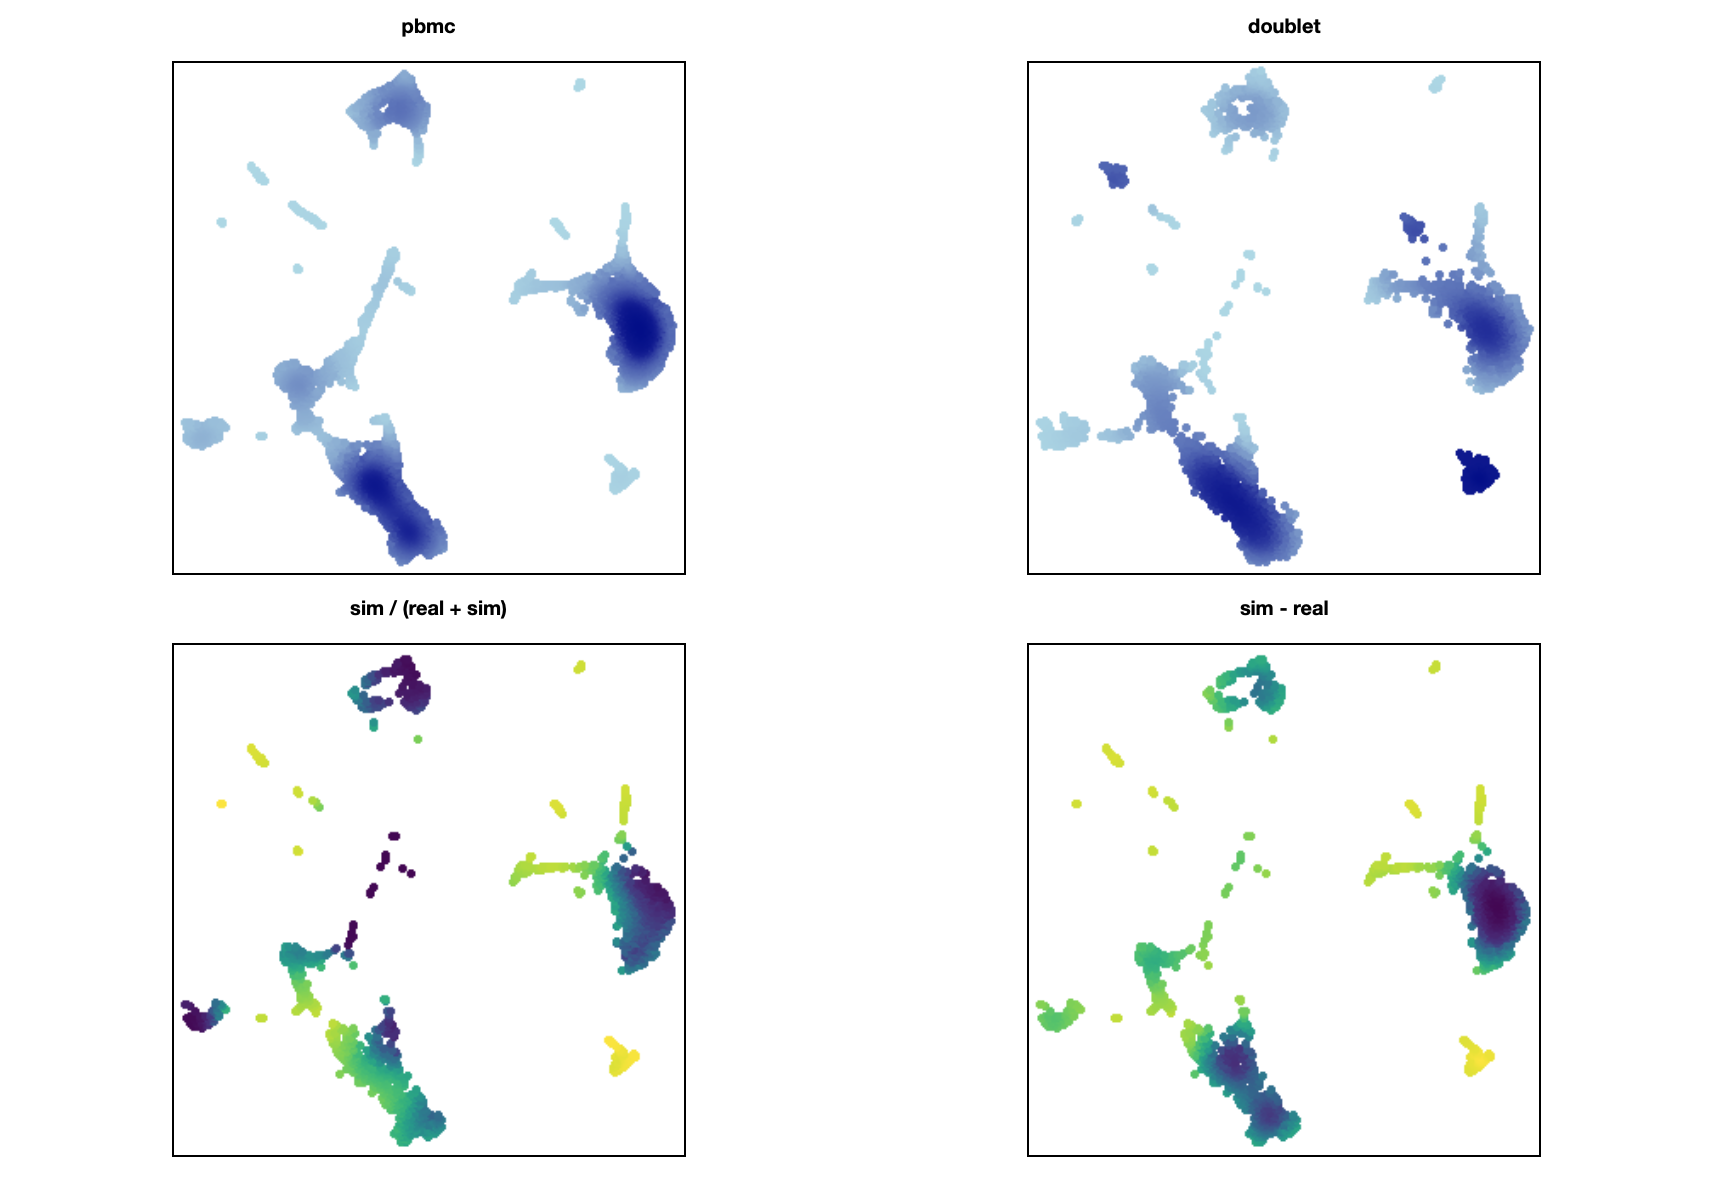
Using the weights from your method, while making the plots look more similar (though there's something weird going on with non-overlapping areas here):
real_density = canvas.points(pbmcdf, 'x', 'y', ds.mean("density"))
sim_density  = canvas.points(dbltdf, 'x', 'y', ds.mean("density"))

tf.Images(
    tf.spread(tf.shade(real_density, name="pbmc"), px=2),
    tf.spread(tf.shade(sim_density, name="doublet"), px=2),
    tf.spread(
        tf.shade(
            sim_density / (sim_density + real_density),
            cmap=palettes.Viridis256
        ),
        px=2,
        name="sim / (real + sim)"
    ),
    tf.spread(
        tf.shade(
            sim_density - real_density,
            cmap=palettes.Viridis256
        ),
        px=2,
        name="sim - real"
    ),
).cols(2)
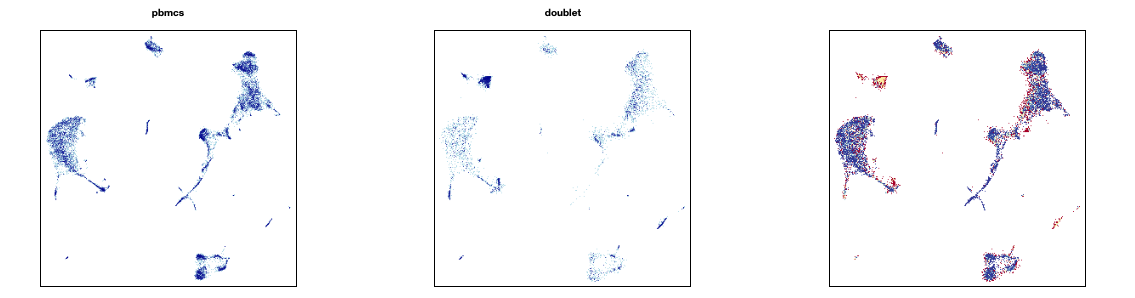
Edit: Sorry for the huge info dump! But also, I think I figured out a more reasonable representation:
real_norm = real / real.sum()
sim_norm = sim / sim.sum()

tf.Images(
    tf.shade(real, name="pbmcs"),
    tf.shade(sim, name="doublet"),
    tf.shade((sim_norm - real_norm) / (real_norm + sim_norm), cmap=palettes.RdYlBu11),
)
Sorry for the late reply, I was afk for a week.
This is really cool... What I had in mind is most similar to the 2D histogram you show. For the second part you fit the umap to one dataset and use that transformation to project the doublets in, right? What I do is join the two datasets and make a combined umap embedding. I can see how your approach makes more sense for doublet detection, but in a general case it's probably not as valid (i.e., when one dataset isn't "fake" data).
I will use this to play around a bit with the package when time permits though... thanks a lot for the extensive code!
And we discussed similar things for the normalization of the data for the subtraction above...