added support for individual cmaps for continous variables
As explained in plotting docs
The color map can also be set individually for each value in adata.obs and adata.var, by setting
adata.uns["{var}_cmap"]. The individual values overwritecolor_map.
I think it's very useful when plotting multiple .obs or .var variables using "color", as the cmaps can then be defined for each embedding individually.
Hi. Thanks for the PR.
I would like to know what is the advantage of this as currently, the cmap value can be passed to any scatter plot.
Can you show an example when this could be useful to have?
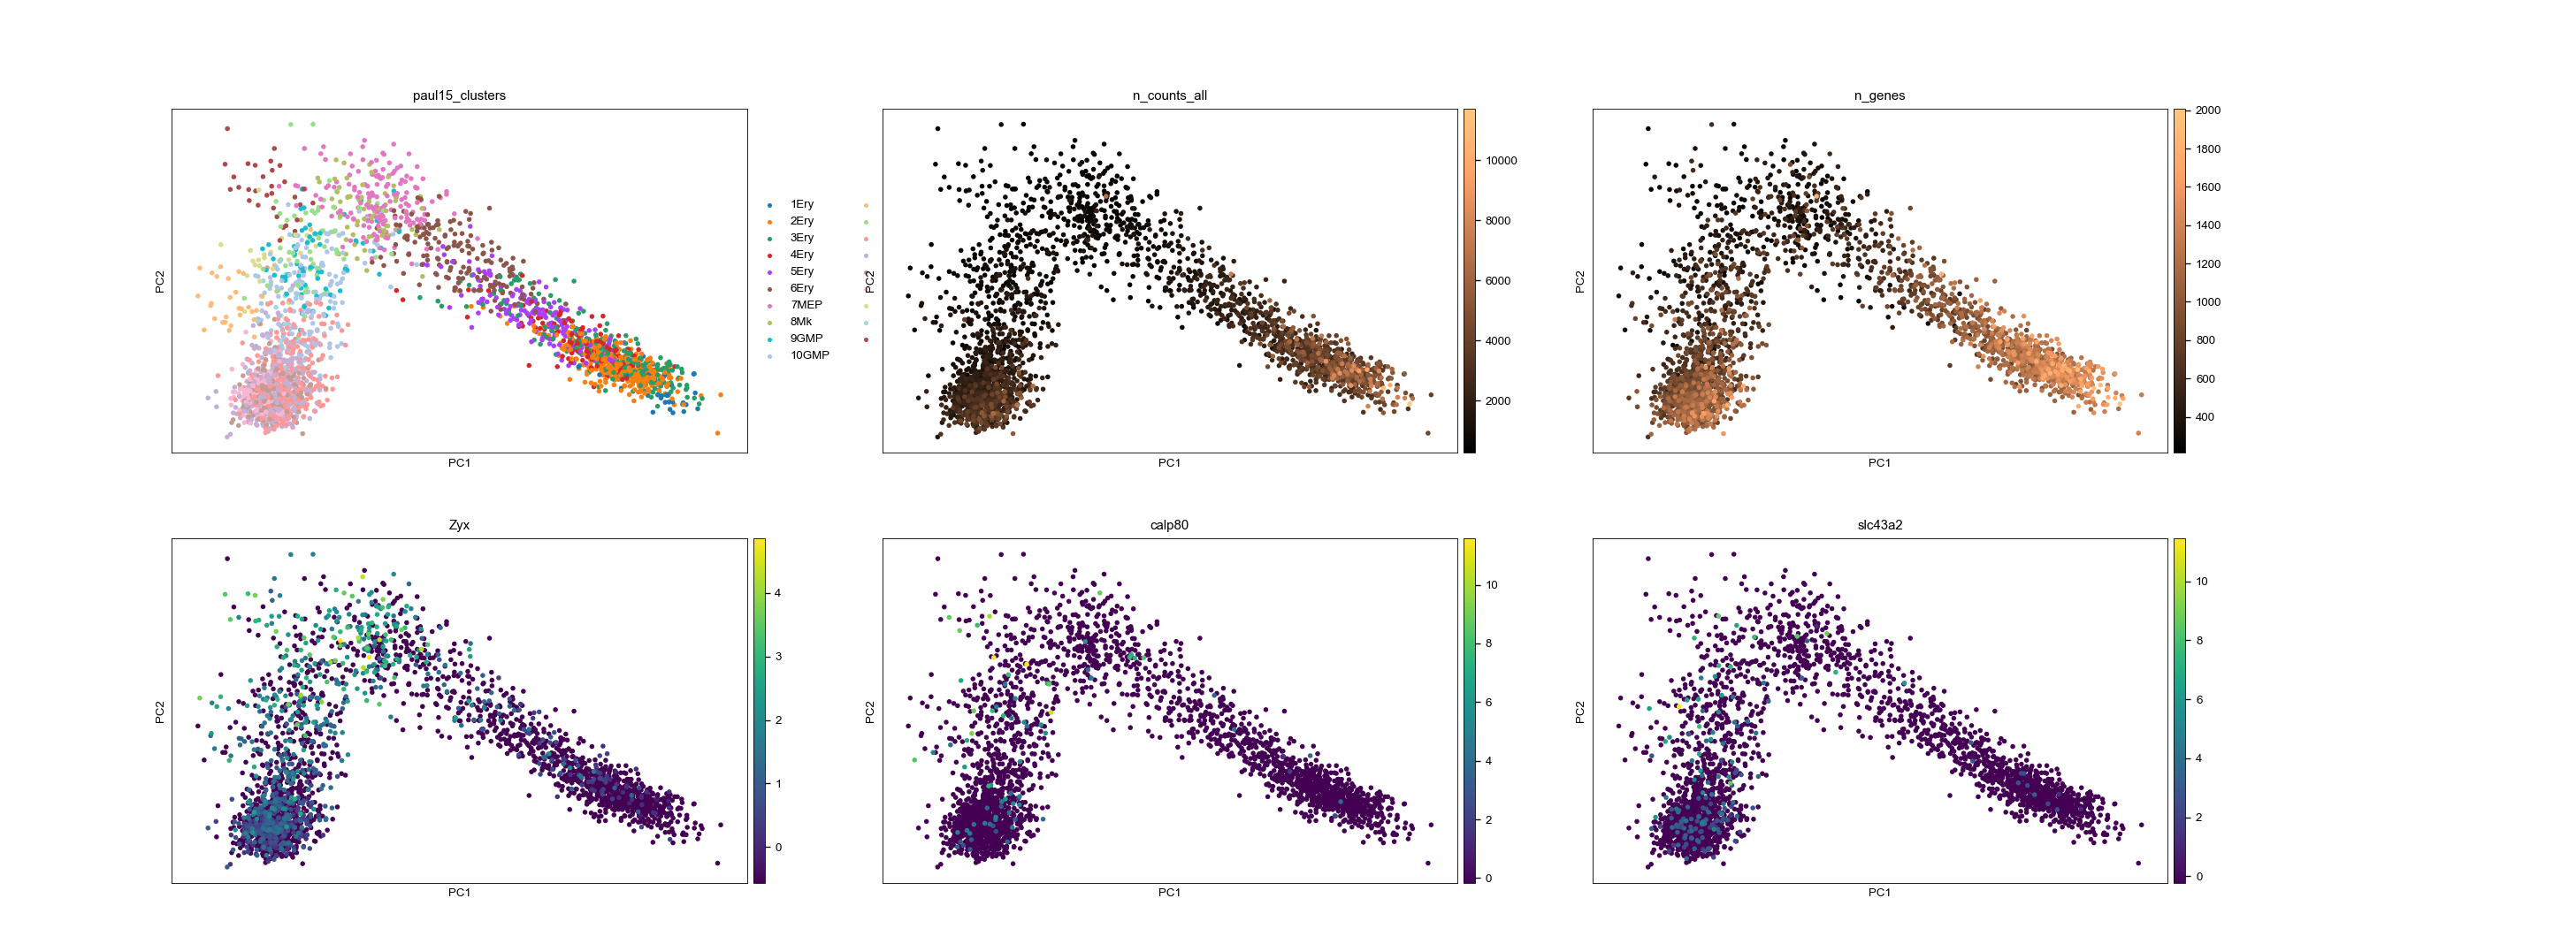
The biggest advantage would be the possibility to create such panels as shown in the example, where e.g. quality metrics have different cmaps as gene expression. Another advantage would be that cmaps could be defined globally for each parameter, resulting in simpler plotting calls.
adata = sc.datasets.paul15()
adata.X = adata.X.astype('float64')
sc.pp.filter_cells(adata, min_genes=100)
sc.pp.recipe_zheng17(adata)
sc.tl.pca(adata, svd_solver='arpack')
adata.uns['n_counts_all_cmap'] = 'copper'
adata.uns['n_genes_cmap'] = 'copper'
sc.pl.pca(adata, color=['paul15_clusters', 'n_counts_all', 'n_genes', 'Zyx', 'calp80', 'slc43a2'], ncols=3)
For some context, this has come up in discussion with cellxgene before: (https://github.com/chanzuckerberg/cellxgene/issues/1152#issuecomment-604286306)
I think I still feel the same way about this. Basically, a continuous colormap is defined by more than just the name of the colorspace. There are parameters like maximum value, minimum value, middle value (for divergent colormaps), scale, and binning. I'm not sure how useful it is to keep just the color scheme without any of these other values. Why this parameter, and not others?
I'm not sure it's the right solution for the use case. I think that use case would be better fit by being able to generate all the plots individually, then collect them into a figure. This way you would have complete control over how the colormaps were applied to each of the continuous variables separately. Unfortunately, this isn't particularly ergonomic to do with matplotlib since individuals plots have to know about the Figure when constructed.
Side issue: We probably don't want to save separate color palettes for each gene.
Ok, makes sense.
What if I implement that cmap in embedding also accepts a dict of {variable: colormap}?
{'n_counts_all': 'copper', 'n_genes_cmap': matplotlib.colors.Colormap}
It maps variable names to str or Colormap. Therefore, the colormap can be processed before and is not stored in AnnData.
Using a dict is an interesting idea.
Right now I'd prefer that it matches with other "vectorized" arguments (like vmin, vmax) which take a list. I think for categorical values the continuous arguments are ignored (right @fidelram?). Using a dict would get rid of the "sometimes arguments are ignored" part of this, but I think consistency is more important here.
I think a problem with a list would be that is would need to be the same length as color, and therefore, each colormap would need to be specifically defined, even for categorical plots.
E.g.
color=['paul15_clusters', 'n_counts_all', 'n_genes', 'Zyx', 'calp80', 'slc43a2']
cmap=['??', 'copper', 'copper', 'viridis', 'viridis', 'viridis']
I don't think that this would make sense...
I agree, but this is also a problem with the other vectorized arguments. I think consistency is important for the API, so that we can just handle each of these arguments the same way. This also makes it easier to make a change across all of these arguments in the future.