Qian Zhang
Results
1
issues of
Qian Zhang

Hi, I want to visualize changes for all the genes significantly branch dependent using `plot_genes_branched_heatmap()`. The simplified trajectory of my data is as following. 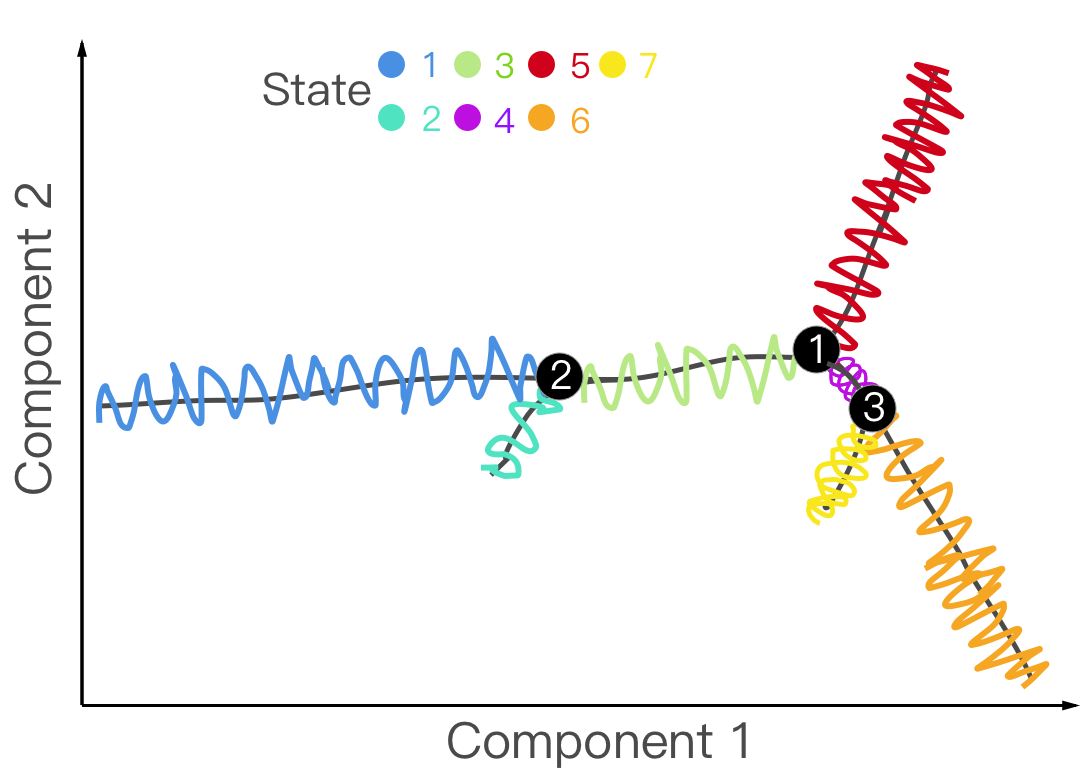 Firstly, I provide a branch...