seaborn
 seaborn copied to clipboard
Statistical data visualization in Python
Note the slight overlap here: ```python ( so.Plot(tips, "total_bill") .add(so.Bars(alpha=.3, edgewidth=0), so.Hist(bins=4)) .scale(x="log") ) ``` 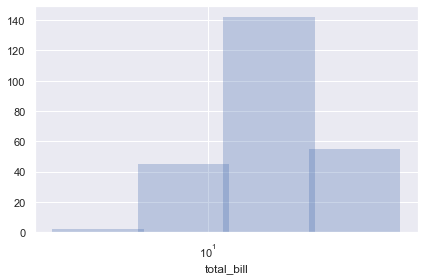 It becomes nearly imperceptible with more bins: ``` ( so.Plot(tips, "total_bill") .add(so.Bars(alpha=.3, edgewidth=0), so.Hist(bins=8))...

Hello. I would like to be able to provide a value to the `num` and `clear` arguments accepted by `plt.figure` ([matplotlib docs](https://matplotlib.org/stable/api/_as_gen/matplotlib.pyplot.figure.html)) when using figure-level functions. Without Seaborn, I would...
Starting with `setuptools==60.0.0` there's a `DeprecationWarning` for distutils version classes: https://github.com/pypa/setuptools/commit/1701579e0827317d8888c2254a17b5786b6b5246 This leads to a warning in seaborn: ```bash $ pip install -U 'setuptools>=60' seaborn $ python -We -c 'import...
```python ( so.Plot(diamonds, "price", color="cut") .add(so.Bar(width=1, edgewidth=.25), so.Hist(), so.Stack()) .scale(x="log") ) ```  This is something we handled in the distribution functions by internally reversing the `hue_order`. That ended up...
```python n = 5000 segments = [] for i in range(n): segments.append( np.column_stack([ np.arange(10), np.linspace(0, i, 10) ]) ) df = pd.concat([ pd.DataFrame(xys, columns=["x", "y"]).assign(i=i) for i, xys in enumerate(segments)...
e.g., `c -> color`, `lw -> linewidth`, similar to matplotlib. This would have to happen without the short forms appearing in (and overwhelming the signature). I would like to do...
Currently we can declare that a `Mark` property should form groups at the property level. The reason we need to do this is that different marks behave differently: e.g. each...
Hi, is it possible to change `fliersize` in `boxenplot`, as in `boxplot`?
Currently `FacetGrid` and its consumers `relplot` and `catplot` will always create a new figure when you call them. In my workflow, I often like to create the figures or axes...
## Issue When plotting with `pd.NA`, axis ordering get reversed into **descending**. ## Workaround `np.nan` does not produce this issue ## Expected Behavior NAs should be excluded without reversing axis...