seaborn
 seaborn copied to clipboard
Published
20 hours ago •
 mwaskom
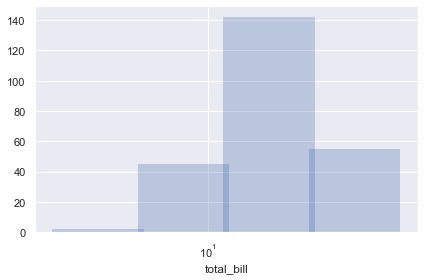
Width computation after histogram slightly wrong with log scale
Note the slight overlap here:
(
    so.Plot(tips, "total_bill")
    .add(so.Bars(alpha=.3, edgewidth=0), so.Hist(bins=4))
    .scale(x="log")
)

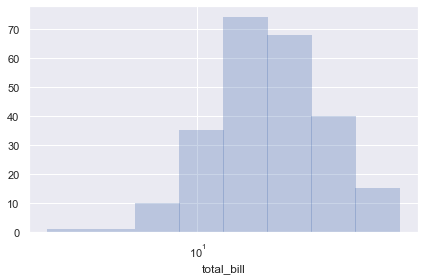
It becomes nearly imperceptible with more bins:
(
    so.Plot(tips, "total_bill")
    .add(so.Bars(alpha=.3, edgewidth=0), so.Hist(bins=8))
    .scale(x="log")
)
This is not about Bars; Bar has it too:
(
    so.Plot(tips, "total_bill")
    .add(so.Bar(alpha=.3, edgewidth=0, width=1), so.Hist(bins=4))
    .scale(x="log")
)