Michael Waskom
Michael Waskom

This is annoying if you've set up a figure and added polished labels to the axes before calling a seaborn function, it will wipe your labels with the names of...
```python so.Plot(tips, "total_bill", "tip", color="total_bill").add(so.Scatter()).scale(color="sqrt") ``` Raises: ```python-traceback --------------------------------------------------------------------------- ValueError Traceback (most recent call last) ~/code/seaborn/seaborn/palettes.py in color_palette(palette, n_colors, desat, as_cmap) 205 # Perhaps a named matplotlib colormap? --> 206...
This would in principle be redundant with the information that you pass to the constructor. But the utility would be to define a common plot in terms of layer definitions...
Concrete use-case is something like combining `Dot` and `Interval` to show a point estimate and confidence intervals. Currently that would require something like ```python Plot(...).add(Interval(), Est()).add(Dot(), Agg()) ``` But that...
Note the slight overlap here: ```python ( so.Plot(tips, "total_bill") .add(so.Bars(alpha=.3, edgewidth=0), so.Hist(bins=4)) .scale(x="log") ) ``` 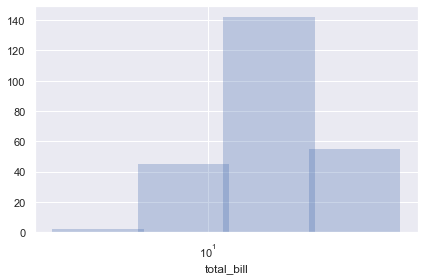 It becomes nearly imperceptible with more bins: ``` ( so.Plot(tips, "total_bill") .add(so.Bars(alpha=.3, edgewidth=0), so.Hist(bins=8))...
```python ( so.Plot(diamonds, "price", color="cut") .add(so.Bar(width=1, edgewidth=.25), so.Hist(), so.Stack()) .scale(x="log") ) ```  This is something we handled in the distribution functions by internally reversing the `hue_order`. That ended up...
```python n = 5000 segments = [] for i in range(n): segments.append( np.column_stack([ np.arange(10), np.linspace(0, i, 10) ]) ) df = pd.concat([ pd.DataFrame(xys, columns=["x", "y"]).assign(i=i) for i, xys in enumerate(segments)...
e.g., `c -> color`, `lw -> linewidth`, similar to matplotlib. This would have to happen without the short forms appearing in (and overwhelming the signature). I would like to do...
Currently we can declare that a `Mark` property should form groups at the property level. The reason we need to do this is that different marks behave differently: e.g. each...
Like `axes_style`/`set_style`, this should report all of the parameters currently set in the theme and work as a context manager. A little trickier because `set()` accepts arbitrary `rcParams` and the...