Mike Bostock
Mike Bostock
We support ordinal color scales: ```js Plot.legend({color: {type: "ordinal", domain: d3.range(10)}}) ``` But trying to do the same with an opacity scale results in an error: ``` Error: ordinal opacity...

Quick take on #1164. 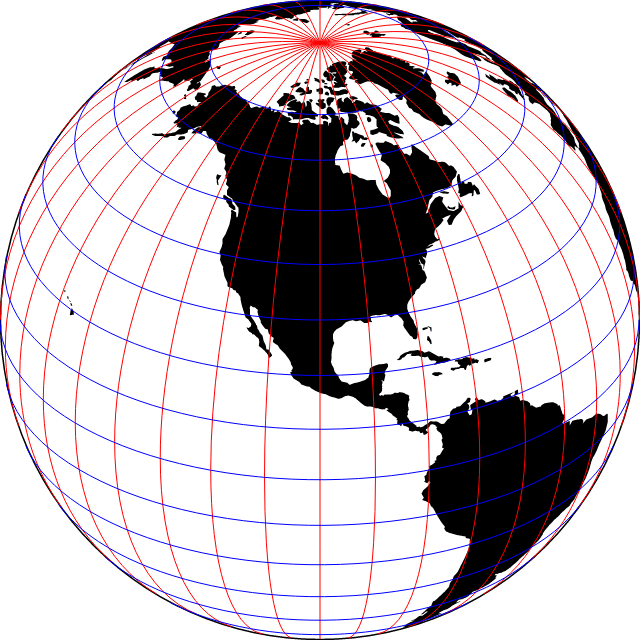 ```js Plot.plot({ projection: { type: "orthographic", rotate: [100, -30] }, marks: [ Plot.sphere(), Plot.geo(land, {fill: "currentColor"}), Plot.ruleX(d3.range(-180, 180, 10), {stroke: "red"}), Plot.ruleY(d3.range(-80, 80, 10), {stroke:...
As noted in https://github.com/observablehq/plot/pull/2132#issuecomment-2489891444:  ```js Plot.waffleY([0.5, 2, 4], {x: null, fill: Plot.indexOf}).plot({color: {type: "categorical"}}) ``` Above, the y-scale only extends from [0, 6.5], but the waffle...
This is a first cut at an alternate take to zooming, focusing on the programmatic API first rather than the interaction. This exposes a _plot_.rescale method that takes scale definitions,...