Maxime Liquet
Maxime Liquet

The `regrid` operation does not seem to take into account `width` and `height` when using the Bokeh backend. The example shows that it does work with the Matplotlib backend. Notice...
The plotly backend seems to support bivariate plots: ```python import numpy as np import holoviews as hv hv.extension('plotly') normal = np.random.randn(1000, 2) hv.Bivariate(normal) ``` 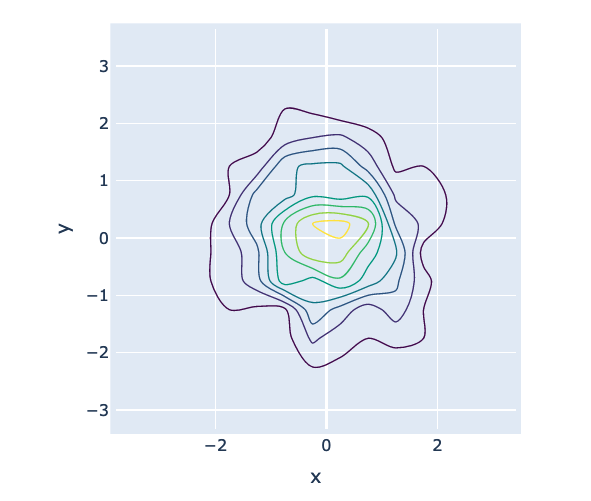 However creating a bivariate plot...
The `show_legend` option doesn't have the same effect given the selected backend. In the example below with `show_legend=True` the legend is displayed with Plotly. It is not displayed with both...
This issue reports an error observed while implementing the matplotlib backend hvplot. It extracts a code path from hvplot that generated the error, as I assumed that the error lied...
From the `master` branch, the issue being on the right plot below which has a `FreeHandDraw` tool attached with the `styles` parameter set. 
The following snippet correctly returns a Box-Whisker plot grouped by *carrier* with the Bokeh backend but just returns an empty plot with the matplotlib backend. ```python import holoviews as hv...
Ticks can be formatted by providing a function which will be compiled to JS using `pscript` (if installed) when using Bokeh. Bokeh has dropped support of this kind of approach...
The test suite sometimes encounters spurious test failures, the last run just failed because of `TestOverlayPlot.test_active_tools_draw_stream` and I've decided to log that in this issue. This is the failing test:...
The last release on PyPi - `pydensecrf 1.0rc3` - dates from 2018. Is there a new release planned? I believe this would help fixing the automatic builds attempted by conda-forge...
As suggested in https://github.com/lucasb-eyer/pydensecrf/issues/114#issuecomment-1136926270 Happy to pick another version number if you prefer of course!