Maxime Liquet
Maxime Liquet

This was first requested in https://github.com/holoviz/hvplot/issues/483#issuecomment-784338535, HoloViews could add support to stacked histograms. Plotly supports that for instance: 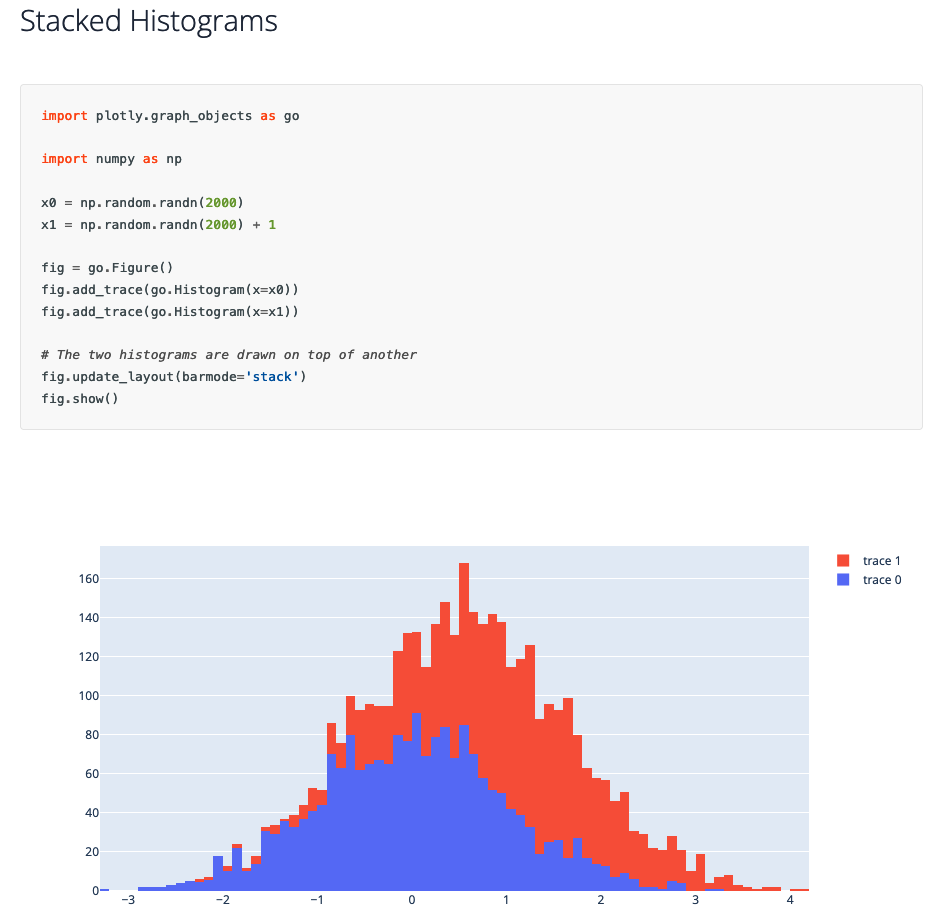
Adding tools to an Overlay via `opts` has no effect. ```python import holoviews as hv hv.extension('bokeh') overlay = hv.Curve([-1, -2, -3]) * hv.Curve([1, 2, 3]) overlay.opts(tools=['zoom_in']) ``` To add tools...
Reviewing the modernized Gerrymandering example, I noticed some issues with rasterizing a scatter plot. Some of them are hvPlot issues, but it looks like there's also one issue in HoloViews....
### Checklist - [X] I added a descriptive title - [X] I searched open requests and couldn't find a duplicate ### What is the idea? `conda config` can be used...
There's code in the converter to support hierarchical columns in a Pandas DataFrame, however it's untested and I think support for this kind of structure broke at some point. https://github.com/holoviz/hvplot/blob/6c96c7e9abcd44380d2122e3d86827dedab32dea/hvplot/converter.py#L1221-L1229...
Fixes https://github.com/holoviz/hvplot/issues/1361 Also: - Cleans up some imports in the test suite, since pandas and panel are direct dependencies of hvPlot their import doesn't need to be guarded - Update...
hvPlot automatically sorts `x` for Pandas when it's a datetime series, feature which can be disabled by setting `sort_date=False`. The code looks like it's trying to support multilevel indexes but...
HoloViews 1.19 added more hover options to control their display and formatting which mean that in most cases you no longer need to create a Bokeh model. Some or all...
By avoiding calling `redim` on each element of an `NdOverlay` which meant that every element had its own copy of the data.
Bokeh 3.4.0 allows to format as HTML the title if its Input Widgets (see https://github.com/bokeh/bokeh/pull/13497). This is a feature I've wanted a few times, in particular when building a form...