mathurinm
mathurinm
I think it's based on the trick where you write the Elastic net as a Lasso, with an extended design X (shape (n_samples + n_features, n_features). The Enet objective (without...
Here's an implementation if you want to play with it: ```python import numpy as np from numba import njit from numpy.linalg import norm import matplotlib.pyplot as plt from benchopt.datasets import...
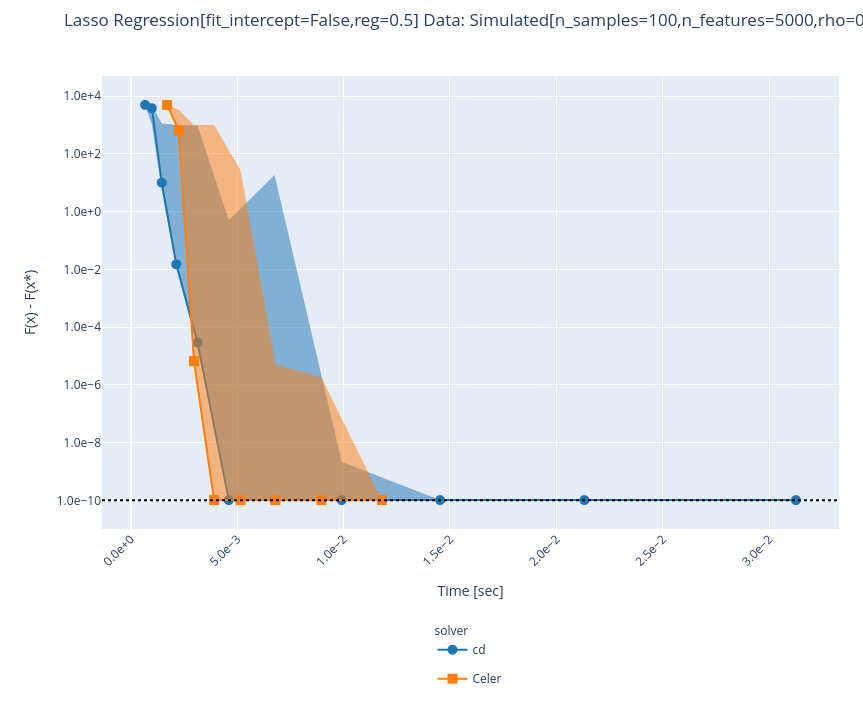
Beware when you see the blue curve suddenly dropping at the end (`figures[-2]`), it is because the solver did not converge and we infer the optimal value as `np.min(primals)`. Also...
Shouldn't ElasticNet.fit() raise a warning or an error saying to use RidgeRegression when `l1_ratio` is equal to 0 ?
setting `permute=False` fixes the issue. There may be a bug because permuting feature order is not an heuristic that can prevent convergence (I may be missing what `permute` does)
I also thought that there was an issue when the two of them were `True`, but in fact for small L1 pen strength, `permute=False`, `shrinking=True` gives different results too: ```python...
I have the same issue with `CDRegressor` in #186
Hello @arose13, I think it may have to do with a wrong choice of `n` (undefined in your snippet, by the way) in your code. The following gives me identical...
I got confused by the strong change when switching to iteration curve. Can we rename to "objective per iteration" and "suboptimality per iteration" ? How do we sell it for...
For the interpolation part, ||main| this PR| |---|---|---| |1 rep||| |5 reps|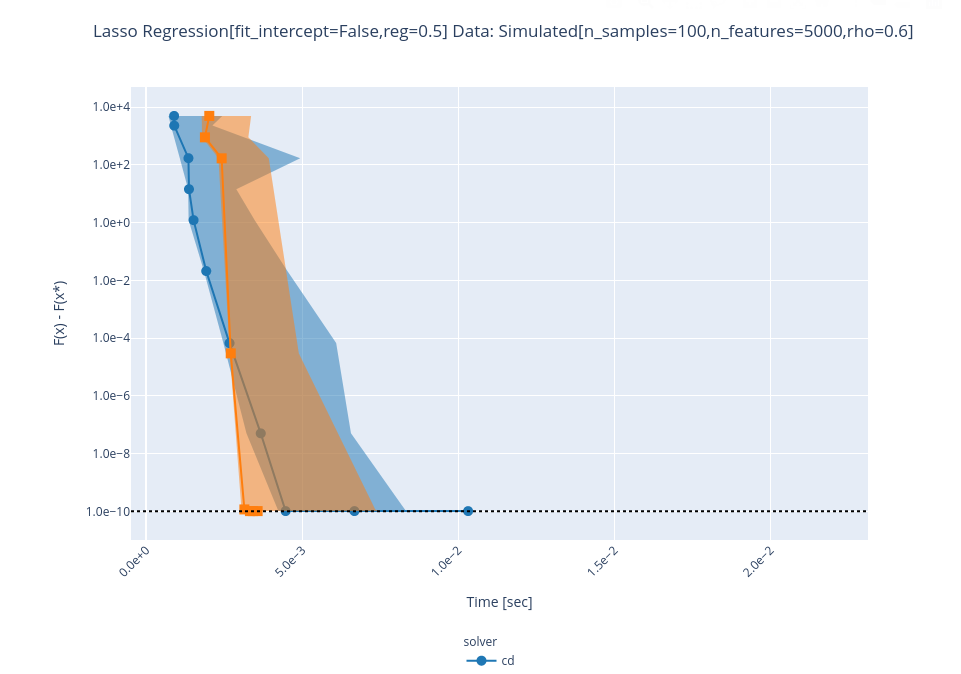|