Results 5 issues of LHP

![image](https://user-images.githubusercontent.com/12290214/168555292-b4144d24-e170-451c-af9f-94d21be88983.png) When user scroll the page, I need hide the crosshairs, and when users click the linechart, I need to show the crosshairs
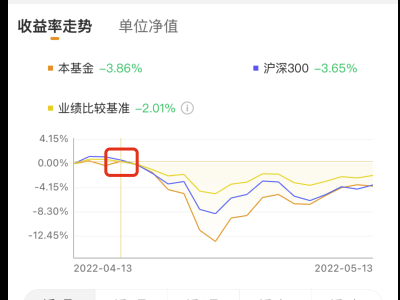
代码和效果图如下图 ![image](https://user-images.githubusercontent.com/12290214/180901838-d68c78ad-97b0-4138-b0f1-d5f902aaa64a.png) ![image](https://user-images.githubusercontent.com/12290214/180901942-fd65fda9-83c6-443f-9ce6-f3473111c129.png) 
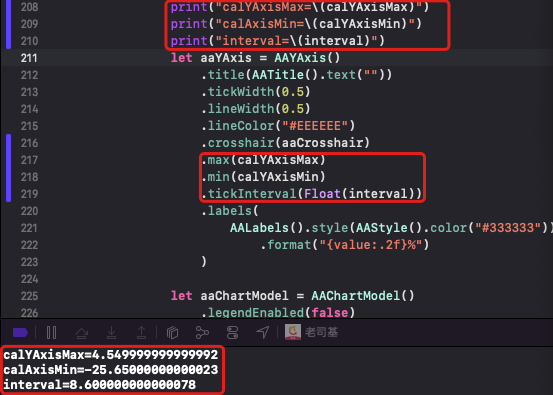
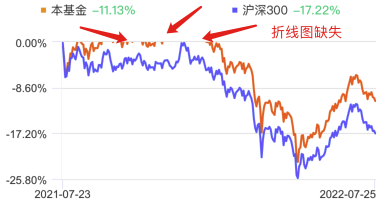
正常情况,折线图最大值设置了4.55,Y轴上面应该还有一个刻度8.60,但奇怪的是没有绘制出来 图表库log日志如下 { "touchEventEnabled" : true, "title" : { "text" : "" }, "chart" : { "type" : "line" }, "legend" : { "enabled" : false },...

代码和效果图如下图 ![image](https://user-images.githubusercontent.com/12290214/183049590-200b7912-8f98-4f2d-8c97-d308c8294a7c.png) ![image](https://user-images.githubusercontent.com/12290214/183050047-7a52cfaa-d84c-41fd-8ba3-aaa02104c258.png) 正常情况,折线图最大值设置了4.55,Y轴上面应该还有一个刻度8.60,但奇怪的是没有绘制出来 已经困扰很多天了,oc的版本我也问了,但是没有回应

![image](https://user-images.githubusercontent.com/12290214/188075158-e653a358-6ccd-45eb-b4ce-b0640107985e.png) 
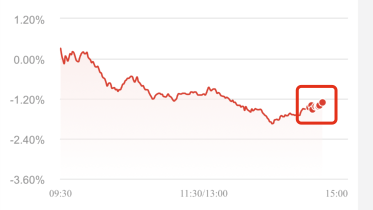
第一次请求数据,在最后一个有效的数据点上添加AADataLabel,没有数据的点将数据置空。 之后,每1分钟会请求新的数据,使用chartView.aa_updateChart(options: aaOptions, redraw: true)重绘图表后,小圆点也被重复的绘制了。

![image](https://user-images.githubusercontent.com/12290214/224005912-250aade5-593c-47bd-bfe8-5d0d5a78924d.png)