Daniel Kovacs
![]()
Daniel Kovacs
[grafana-agent-logs-logs-mrtw8.zip](https://github.com/grafana/agent/files/8487615/grafana-agent-logs-logs-mrtw8.zip) Hi, Added one from an instance which is having around 350MB memory usage. Thanks
I'm not sure, if we are not misusing some features, the scenario for us is the following: - we use the grafana-agent operator to look for PodLogs CRD objects -...
We have 95 PodLogs in that cluster. But it seems, that memory utilization is growing as time goes and only the OOMkiller can stop it: 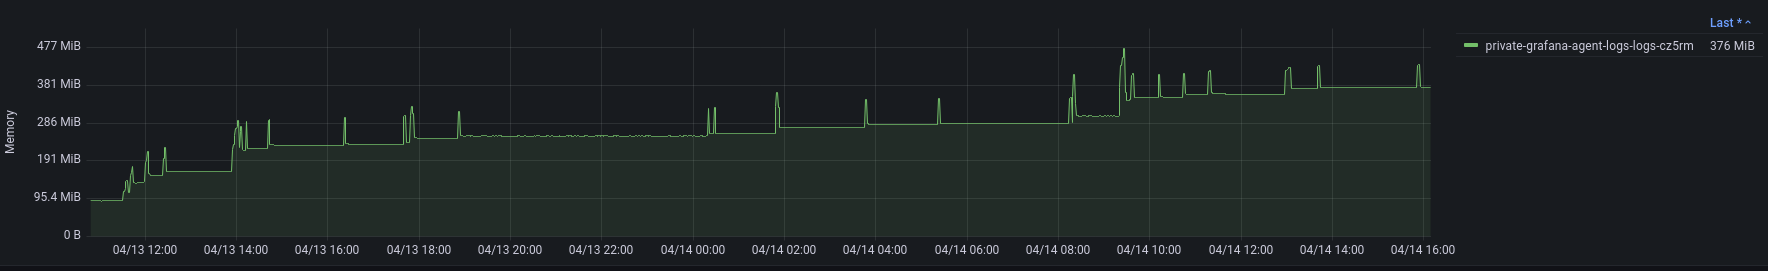 I can give it...
Yeah, seems to be increasing: 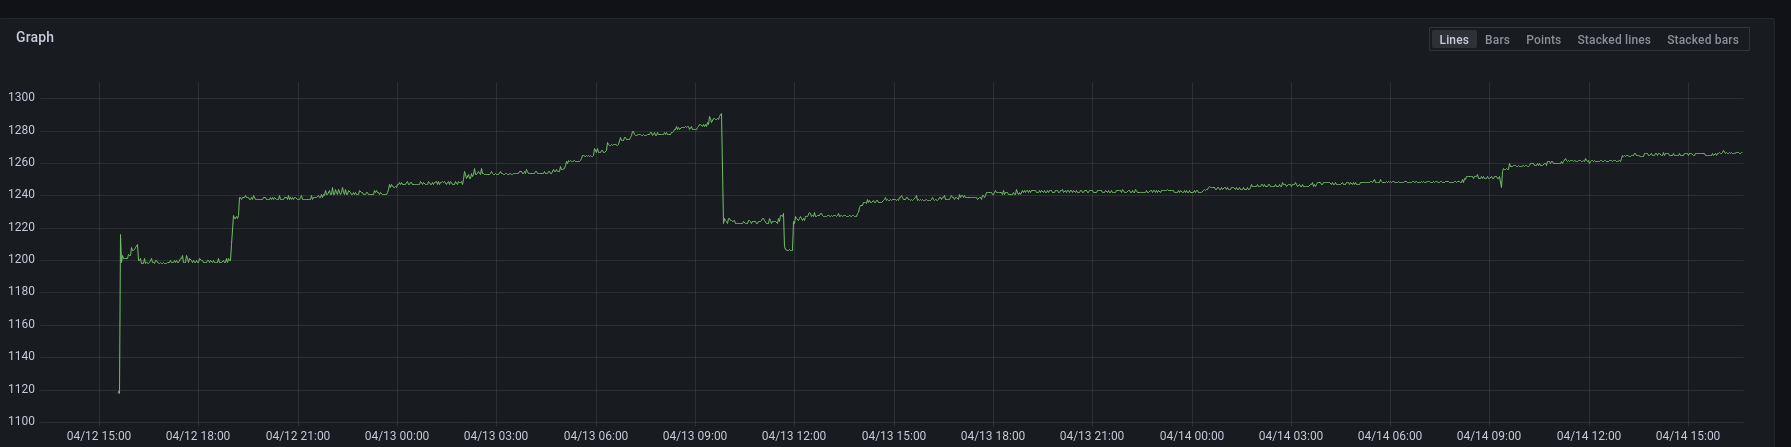 But we don't really change the configs often of the PodLogs Kubernetes requests: 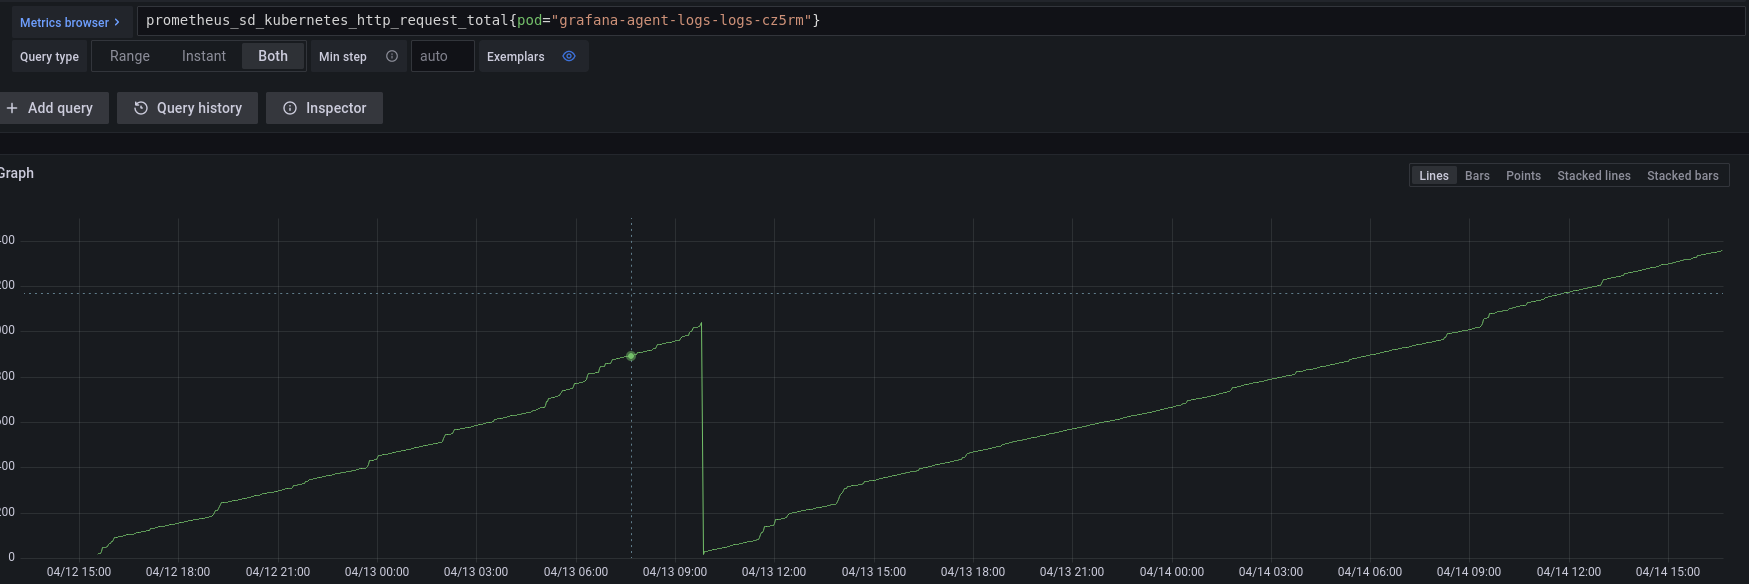
Okay, thanks!
On one cluster I changed to have only one PodLogs object (blue), on the other we have now around 65 (yellow), I restarted all the daemonset instances and let them...
For this, the memory usage is around 450MB: [goroutine-debug.txt](https://github.com/grafana/agent/files/8537576/goroutine-debug.txt)
Hi, We have the same problem with the S3 access, but we are migrating from Cortex to Mimir. With cortex everything was fine, can the HttpPutResponseHopLimit still be the problem?...
A few months ago I upgraded to 0.24.2 (helm: 0.2.0), and it seems that it solved the issue, the memory usage is pretty normal now, I just forgot to update...
We have the same issue, Pulumi create the new LaunchConfiguration then tries to delete the old before replacing with the new, so it fails.