Zhanibek
Zhanibek
The new version works better
In the 4 plot example above, the font size doesn't scale, the tick marks (little marks above ticks) don't scale, title font doesn't scale, legend font doesn't scale, size of...
At this point it's a debate of tastes I feel. My arguments are: 1. Stay consistent with other backends 2. Stay consistent with other plot elements In my opinion, the...
The scaling is an artifact of figure size changing, running your example but without figure size specification: `plot(p1, p1, p1, p1; layout=(1,4), legend=:outertop)` 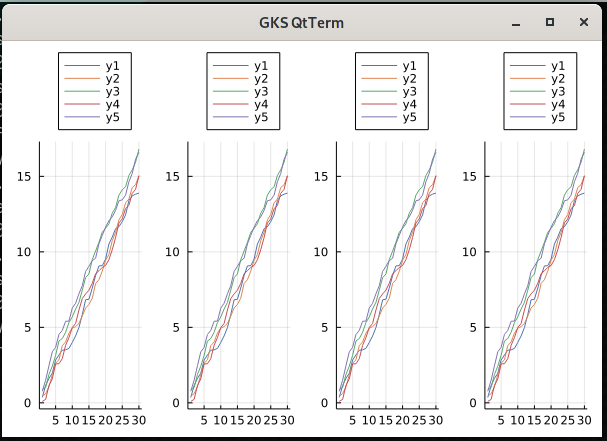
Looks like the legend box keeps its size (more or less) when comparing with the most basic case: 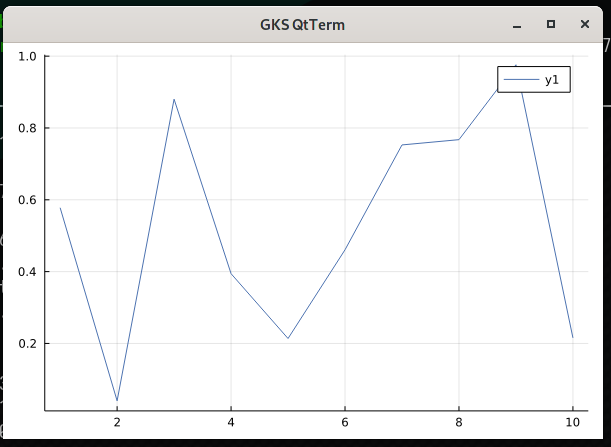
Yes, I mean the total figure size. I'm too accustomed to matplotlib semantics: Figure (the whole thing), Ax (subfigure)
How about just reducing the legend font size?
I agree that the new behavior is not perfect, I think none of these plots look good. The ideal solution would be preserve the size of the legend box so...
The problem right now is that the newest iteration calculates the size of the legendbox based on the figure size (600x400) by default. Instead, it should always be of the...
I'm not good at the GR backend, but the relevant code is here https://github.com/JuliaPlots/Plots.jl/commit/acb5d5ac4bc6b840aef36330a4087e7b8ac41dfc When testing, please compare with pyplot and pgfplots output to verify the behavior.