Christian Lorentzen
Christian Lorentzen
Could we flip x- and y-axis such that predicted values are on the x-axis and observed values on the y-axis? This way, the x-axis would be the same as for...
I find it bad UX to have the same function put the same thing (predicted values) on 2 different axis depending on the `kind` parameter. This is particular so with...
It's not all that simple: - Residual (y) vs predicted (x) seems common ground. But note that it only makes sense if predicting the mean E(Y|X), it is nonsense (in...
I really do not intend to block this PR, but I'm not at ease in it's current form. Could we please start minimal with only the plot of the residuals?
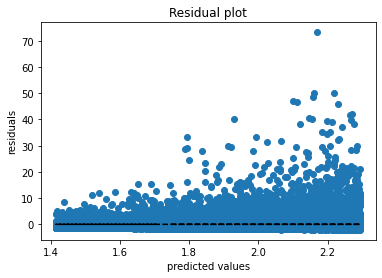
Consider the following plots: #### 1. residuals  You don't see much, a heatmap might be better, or boxplots with binning. It could be, that the mean residual is approximately...
> I agree that it requires to be careful when interpreting these plots, but it's the case for everything. I don't think it's enough to just discard it. As said...
@adrinjalali Do you have an opinion for this one?
I know that this one was opened earlier, but I close as duplicate of #24614. So we can have the discussion in a single place instead of scattered.
If I may add, it would be very nice to have a better technical documentation of `DMatrix`, in general. I think it is a very central "piece" in xgboost (the...
@josef-pkt I don't. But now that `wright_bessel` is available, it shouldn`t be too hard. The most important is to have a reliable source for the formulae. The Exponential Despersion Model...